 A305403A
[21-AUG-26] This page serves as a record for the testing performed using the A3054-VT (Voltage-Controlled Oscillator Test Fixture).
First, establish that the small SMD-5 SAW filters are able to be loaded effectively onto the PCB. Apply solder paste to P2-P5 and L4 footprints. Place UMCC jacks on the solder-pasted P2-P5 footprints, and load B2672 SAW filter onto solder-pasted L4 footprint. Heat the board in solder oven. After the solder oven has finished heating and cooling, the newly formed joints are inspected. P2-P5 joints show no problems. L4 shows some joints that appear to be solid, other joints are not immediately visible. Using a hot droplet of liquid solder, heat the top of the L4 package to reflow the joints. Wash and further inspect board.
P4 and P5 are the input and output, respectively, of the 10 mm 7-mil 'control' track on the PCB. Attach the 'calibrate out' output of an A3052 analog signal generator to control-input (P4). Route control-output (P5) to the RF-input of a ZAD-11 RF mixer. Use a handheld signal generator to power the ZAD-11 local oscillator with 860 MHz at 7 dBm. Using LWDAQ "DM_Check" tool, instruct the analog signal generator to perform a frequency sweep from 880-950 MHz. Plot the 'tune out' output of the analog signal generator (Yellow), along with the ZAD-11 intermediate frequency (Blue), using an oscilloscope:
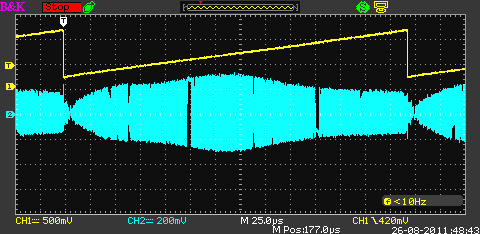
The ZAD-11 I.F output will not be visible on the oscilloscope when the RF and LO inputs have the same frequency. Therefore, Ch2 will read 0V when the analog signal generator and handheld signal generator are both putting out 915 MHz. Set the handheld signal generator to output 915 MHz at 7 dBm. Verify that the I.F output drops to 0V during the frequency sweep. Adjust the scope window such that this 0V reference is in the center (both horizontal and vertical) of the window. Now the display of the frequency sweep has 915 MHz at the center. Knowing that the frequency is stepped from 880 to 950 MHz, the timescale of the display is set such that each horizontal subdivision of 25 us corresponds to ~4.75 MHz (70 MHz range / 14.75 horizontal subdivisions):
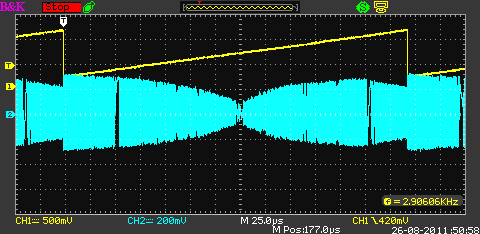
Change L.O frequency to 860 MHz. Measure IF amplitude at 915 MHz. IF amplitude at 915 MHz is about 416 mVpp.
Attach analog signal generator output to P2. P2 is the input of the 10 mm track with SAW filter ('filter-track'). Attach P3 (filter-track output) to the RF input of the ZAD-11 mixer:
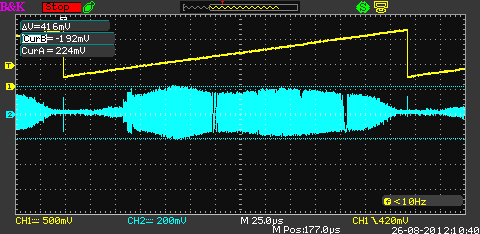
Keep L.O frequency at 860 MHz. Measure IF amplitude at 915 MHz. I.F amplitude at 915 MHz is about 312 mVpp
It has now been established that the small SMD-5 SAW filter package may be loaded effectively using the solder oven. Next, load four more A305403A boards with P2-P5 UMCC jacks and 4 distinct SAW-filters on L4.The SAW filters in use are as follows (each 'Board' refers to a seperate A305403A assembly):
Board I: B2672
Board II: B2671
Board III: B2625
Board IV: B4301
Board V: B4344
Following the same process as outlined above, apply solder paste to P2-P5 and L4 footprints of boards II-V and reflow in the solder oven.
After using the solder oven to load SAW filters and UMCC connectors onto four A305403A boards, measure the loss of each SAW filter by comparing it to the output of the 'control' wire on the same board.
Repeat the same test for all five boards, comparing control amplitude and filter amplitude at 915 MHz. Note that all values in the table below are in mVpp:
| Filter | Board # | Control (880 MHz) | Control (890 MHz) | Control (900 Mhz) | Control (910 Mhz) | Control (920 MHz) | Control (930 MHz) | Control (940 MHz) | Control (950 MHz) | Filter (880 MHz) | Filter (890 MHz) | Filter (900 MHz) | Filter (910 MHz) | Filter (920 MHz) | Filter (930 MHz) | Filter (940 MHz) | Filter (950 MHz) | |
|---|---|---|---|---|---|---|---|---|---|---|---|---|---|---|---|---|---|---|
| B2672 | I | 536 | 568 | 512 | 480 | 392 | 352 | 344 | 312 | 64 | 88 | 448 | 336 | 360 | 360 | 280 | 64 | |
| B2671 | II | 544 | 592 | 512 | 472 | 392 | 360 | 328 | 296 | |||||||||
| B2625 | III | 552 | 584 | 520 | 480 | 400 | 352 | 320 | 296 | 40 | 112 | 360 | 344 | 392 | 352 | 72 | 40 | |
| B4301 | IV | 544 | 584 | 512 | 472 | 392 | 352 | 320 | 288 | 40 | 64 | 352 | 320 | 384 | 344 | 192 | 32 | |
| B4344 | V | 536 | 568 | 520 | 472 | 392 | 360 | 320 | 296 | 48 | 48 | 360 | 344 | 408 | 336 | 56 | 48 |
[24-AUG-26] The value of R1, the NPN Amplifier base resistor, must be determined. Make an estimate for R1. Assume the collector current must be 3 mA. At this collector current, the base-emitter voltage must be around 0.8V. Assuming ON is powered by 3.3V, the voltage across R1 must be ~2.5V. To determine the current through R1 (Base current), estimate the current gain to be about 75. The base current then is 3 mA / 75. Base resistance would then be 62.5k. Use this as the starting point to adjust R1 to achieve 3 mA collector current with ON at 3.3V and collector power at 1.5V.
Begin partial assembly of an oscillator to test the collector current with a resistor near 62.5k. Load the following parts onto the board:
Q1A, Q1B, Q1C: NSVF4009SG NPN 25GHz Amplifier
L1A: 220 nH
R1A: 52.6k
R1B: 3 x 180k (in parallel, presenting 60k)
R1C: 75k
P1: MOLEX-2
C7A, C7B, C7C: 100p
C8: 1u0
C9: 1n0
J1: BNC Right-Angle
R4: 51R
[26-AUG-26] Assemble a bechtop power supply in series with an ammeter. Use this to supply 1.5V on P1 (MOLEX-2). Set a benchtop signal generator to the 'noise' setting at 3.3 V mean, 0.5 mV stdev. Attach this signal generator to the J1 BNC. This will supply ON with 3.3 V.
Turn on the benchtop power supply and signal generator. Measure the current drawn through the ammeter. Turn off benchtop power supply and signal generator. Remove R1A and L1A, and load R1B and L1B on the board. Turn on benchtop power supply and signal generator. Measure the current drawn through the ammeter. Remove R1B and L1B, load R1C and L1C, and repeat this process. Current measurements are tabulated below:
| R1 (Ohm) | Ic (mA) | Base-Coll. Voltage (V) |
|---|---|---|
| 52.6k | 0.05 | N/A |
| 60k | 0.05 | N/A |
| 75k | 0.04 | 1.7 |
Measure the voltage across R4 to determine the voltage being provided to ON. Voltage across R4 is measured at ~3 mV.
Instead of powering ON with the benchtop signal generator, attach atwo silver ion batteries in series to a battery holder. Solder wires to the pins of the battery clip and insulate these solder joints with heatshrink. Remove R4. Solder the battery clip wires to the pads of R4. Voltage across the pins of R4 is 3.16V.
Repeating the process outlined above, test three resistance values at R1. Measure collector current. Results are tabulated below:
| R1 (Ohm) | Ic (mA) | Base-Coll. Voltage (V)|
|---|---|---|
| 52.6k | 3.86 | 0.83 |
| 60k | 3.58 | 0.98 |
| 75k | 2.96 | 1.13 |
[28-AUG-26] Determine whether L3 and C6 will oscillate when the quiescent current of 3 mA is applied from Q1-collector. Load the following parts on the board:
L3A: 43 nH
C6A: 0.6 pF
R1A: 75k
C1A: 100p
P1A: UMCC Jack
R2A: 200R
Using two silver oxide batteries in series, apply 3V to ON. Supply 1.5V to P1 using a benchtop power supply. Verify that the current supplied is 3 mA. The current supplied is 2.95 mA.
The natural frequency of L3A and C6A is calculated to be 990 GHz. Attach P1A to the RF input of a ZAD-11+ mixer. Using a handheld RF signal generator, apply 980 MHz at 10 dBm to the local oscillator input of hthe mixer. View the intermediate frequency output on the oscilloscope.
Nothing is observed on the oscillozope. Load the remaining parts onto the oscillator, except for the DPDT switch. Instead of loading the switch, connect pads 3 and 9 with a small wire.
Note that C6 is 0p6 and L3 is 43n. Power the board with 3V from the silver oxide batteries, and apply 1.5V to P1. 2.87 mA is supplied from 1.5V. Mixing the output of P1A with 990 MHz 10 dBm, nothing is visible on the oscilloscope.
0p6 and 43n will resonate at about 990 MHz, which is well outside the pass band of the SAW filter. Instead, load C6 with 0p8 and load L3 with 39n, which should resonate at around 900 MHz.
Apply 3V to ON with silver oxide batteries. Apply 1.5V to P1 with benchtop power supply. Set handheld RF signal generator to put 910 MHz 10 dBm on the mixer's local oscillator input. The current drawn from 1.5V is 2.93 mA. Nothing is visible on the oscilloscope.
[31-AUG-26] Measure the phase of the SAW filters. Terminate outputs 3 and 4 of a 4-way ZB4PD1-2000+ splitter with 50 Ohms. Route one of the split signals to P4, the 'control' input on the VCO test board. Route the other of the split signals to P2, the 'filter' input on the VCO test board. Terminate the remaining two splitter outputs with 50 Ohms. The pair of cables connecting 'filter' and 'control' inputs to the splitter are the same length.
Attach a handheld RF signal generator to the input of a ZAPD-1+ splitter. Route output 1 of the splitter to the local oscillator of a ZAD-11 mixer. Route output 2 of the splitter to the local oscillator of a second ZAD-11 mixer. The pair of cables connecting the 4-way splitter to ZAD-11 mixers are the same length.
On the VCO test board, route the 'control' output (P5) to the RF-input of one ZAD-11 mixer, and route the 'filter' output (P3) to the RF-input of the second ZAD-11 mixer. The pair of cables connecting 'filter' and 'control' to the ZAD-11 mixers are the same length.
Route each of the IF outputs to it's own channel on the scope, terminating with 50 Ohms using a BNC T-junction. The pair of cables connecting the IF outputs to the scope are the same length.
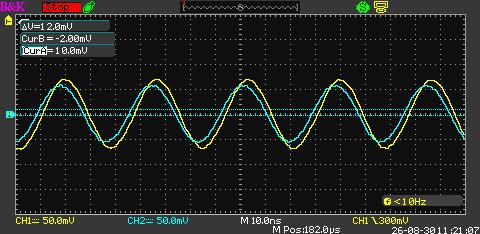
The analog signal generator (ASG) generates a 900 MHz signal. This signal is split into two through the ZB4PD1-2000. The two 900 MHz signals are brought to 'control' and 'filter' inputs. The outputs of 'control' and 'filter' are each mixed with half of an 890 MHz 10 dBm signal. The IF outputs are compared at the oscilloscope to measure the phase between them:
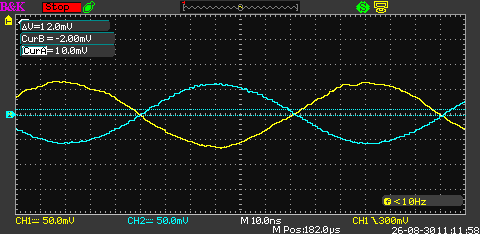
The input frequency generated by the ASG is referred to as the 'Test freq'. The frequency generated by the handheld signal generator, used to power the local oscillators of the mixers, is called the 'LO freq'. Repeat the experiment using a Test Freq. of 920 MHz, to determine whether the apparent 90-degree phase changes at all with frequency.
ASG transmits 920 MHz. LO Freq. is 890 MHz. The output of the mixers now shows a different phase, much closer to 180 degrees:
Repeat this experiment with a range of Test Freq 880-950, for each of five SAW filters. LO Freq. is fixed at 880 MHz. Use the oscilloscope's built in feature to measure the phase between the two signals.
| Board # | SAW Filter | Test (MHz) | Phase (Deg) |
|---|---|---|---|
| I | B2672 | 895 | 90 |
| I | B2672 | 900 | 170 |
| I | B2672 | 905 | 220 |
| I | B2672 | 910 | 270 |
| I | B2672 | 915 | 300 |
| I | B2672 | 920 | 330 |
| I | B2672 | 925 | 350 |
| I | B2672 | 930 | 20 |
| II | B2671 | 895 | |
| II | B2671 | 900 | |
| II | B2671 | 905 | |
| II | B2671 | 910 | |
| II | B2671 | 915 | |
| II | B2671 | 920 | |
| II | B2671 | 925 | |
| II | B2671 | 930 | |
| III | B2625 | 895 | 70 |
| III | B2625 | 900 | 140 |
| III | B2625 | 905 | 220 |
| III | B2625 | 910 | 270 |
| III | B2625 | 915 | 310 |
| III | B2625 | 920 | 340 |
| III | B2625 | 925 | 20 |
| III | B2625 | 930 | 80 |
| IV | B4301 | 895 | 10 |
| IV | B4301 | 900 | 100 |
| IV | B4301 | 905 | 190 |
| IV | B4301 | 910 | 230 |
| IV | B4301 | 915 | 290 |
| IV | B4301 | 920 | 320 |
| IV | B4301 | 925 | 5 |
| IV | B4301 | 930 | 50 |
| V | B4344 | 895 | **** |
| V | B4344 | 900 | 30 |
| V | B4344 | 905 | 170 |
| V | B4344 | 910 | 220 |
| V | B4344 | 915 | 280 |
| V | B4344 | 920 | 320 |
| V | B4344 | 925 | 0 |
| V | B4344 | 930 | 60 |