| 2010 | 2011 | 2020 | 2021 | |
| 2022 | 2023 | 2024 | 2025 |
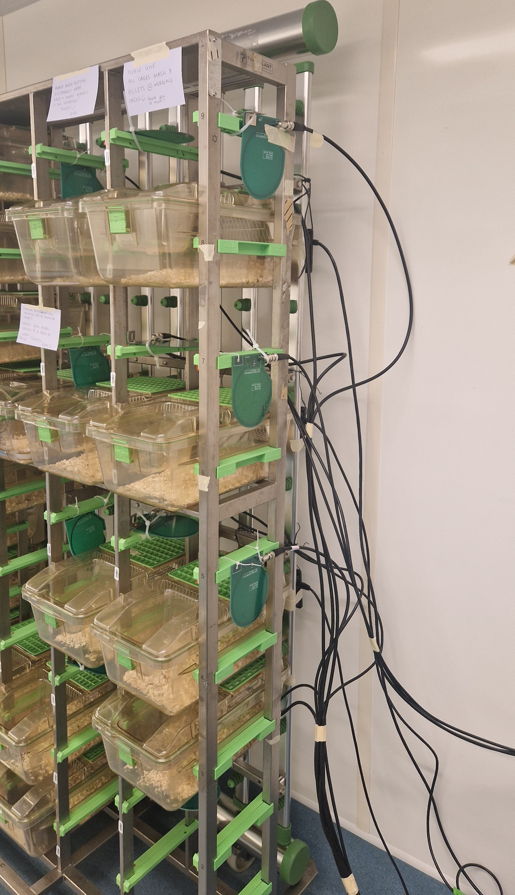
[14-MAR-22] Here we record our work on measuring and improving reception of telemetry signals by our SCT data acquisition system. Before investing in one of our telemetry systems, check the cell phone tower database to see if there is a base station nearby. Radio frequency telemetry can be challenging if we are within fifty meters of the most powerful base stations, and within ten meters of the weaker ones.
[26-JUL-10] We receive M1278417564 from Rob at ION. Transmitters No4 and No8 record EEG for an hour. Rob is pleased with the recordings, but reception robustness is only 75% for both transmitters, while our target is 95%. We do not understand the poor reception. Earlier this year, Matthew fixed poor reception in one experiment by re-seating the enclosure lid. Rob suspects that the faraday enclosure lid was not replaced properly by the animal caretakers, but we cannot confirm this hypothesis.
[06-AUG-10] At CHB, we record 1000 seconds of data in archive M1281121460 from a rat roaming freely in the faraday enclosure with transmitter No10. We use a newly-refurbished Data Receiver (A3018C). The transmitter electrodes cemented to the skull using silver epoxy. The rat spends most of its time along the edges of the enclosure and in the corners, often pressing the transmitter close to the conducting walls. Reception in 4-s intervals is 93% on average, 5% minimum and 99% maximum.
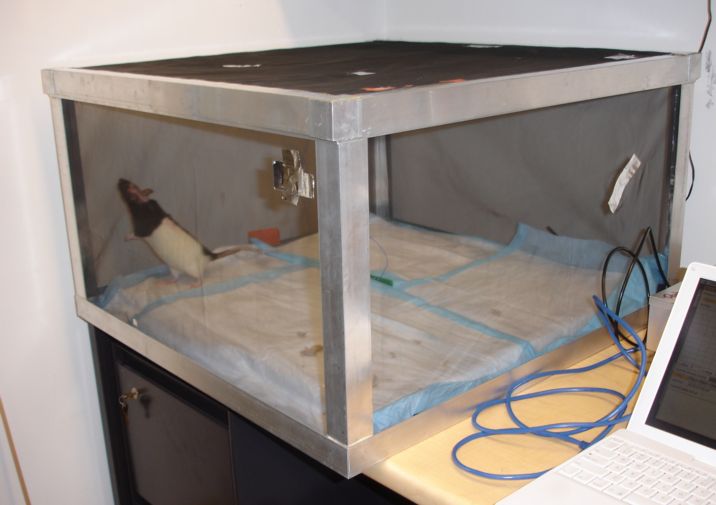
We put the rat in a cage within the enclosure. It roams around the cage, going from within a few centimeters of the antenna to within a couple of centimeters of the wall. We record 140 seconds in archive M1281122799. Reception is 98.3%, with minimum 97% and maximum 99.3%.
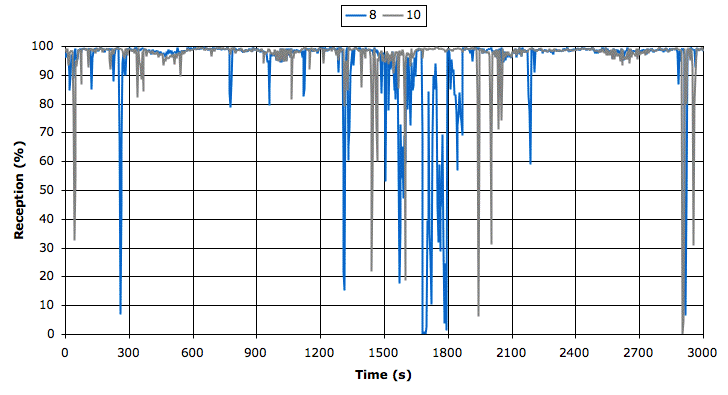
[10-AUG-10] At CHB, Yingpeng implants transmitter No8 and Sameer records three one-hour archives. Speaking of the first archive, he says, "I observed that the signal reception had dropped significantly when I was checking mail on my iphone while sitting close to the cage (File # M1281455686, t~800sec). So I deliberately turned on the 3G network on my phone and the EEG reception was lost again (File # M1281455686, t~1100)."
At times 800 s and 1100 s, reception from both transmitters stops almost completely and simultaneously. Also, Sameer injects both animals with kainic acid during the recording, which requires the lid of the faraday enclosure to be removed. Injection times are No8 300-365 s and No10 370-430 s. For the entire M1281455686 recording, reception robustness was 90% for No8 and 95% for No10. Our target is 95%.
We looked up the frequency and power output of the iPhone. In the US, it uses 869-894 MHz. The maximum permissable output power for a cell phone in this band is 33 dBm, or 2 W, and it appears that most phones are able to transmit the full 2 W, although they most often operated at much lower power output. Even with the best band-pass filters, there will still be 10% of the power spilling over into the low end of our 902-928 MHz ISM band. Our transmitters project around 50 μW out of the animal's body. The enclosure we lent to ION provides between 20 dB (99%) and 40 dB (99.99%) interference rejection, depending upon how well the lid is sitting on the frame. Furthermore, the signal from a transmitter must be at least 10 dB (ten times) more powerful than interference for proper reception. It is easy to see that an iPhone transmitting at the right frequency, just outside the enclosure, will stop reception from an implanted transmtter.
Furthermore, this setup uses an unshielded cable to deliver power to the Data Receiver. It turns out that unshielded cables are associated bad messages, which suggests that they allow interference to enter the system and corrupt the radio reception. See here for more details.
In M1281460570 we see three periods of simultaneous signal loss and one period several minutes of poor reception from transmitter No8. For the entire recording, robustness is 92% and 98% for No8 and No10 respectively.
In M1281464170 we see no periods of simultaneous signal loss, as you can see in the above graph. Robustness is 95% and 99% for No8 and No10 respectively.
[11-AUG-10] We hear from Stephanie at ION on the subject of cell phone interference. "How interesting! Rob certainly has an iphone, and while there was no computer up there, standard procedure involved using said iphone to call matthew in his office to ask if transmitters were on or off."
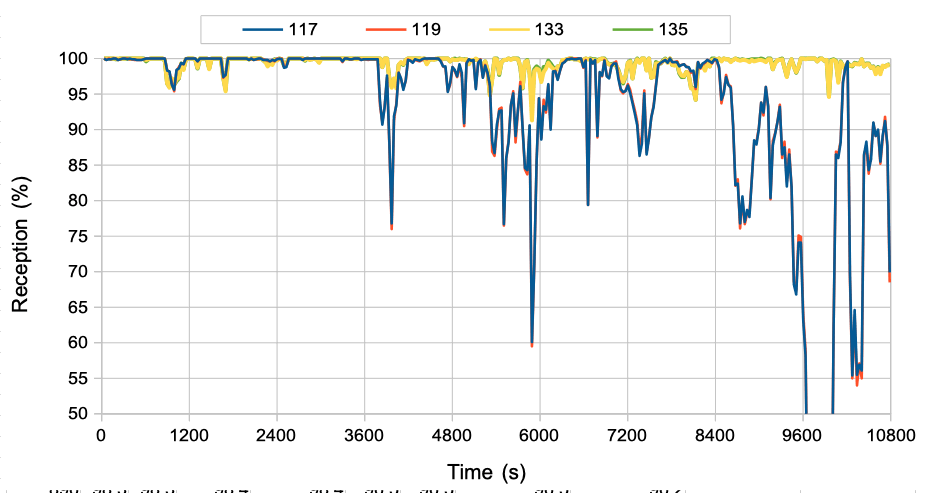
[12-AUG-10] Sameer sends us M1281643595 and M1281647588 in which the signal from implanted No6 is recorded over 7000 s. The following figure shows reception during all 4-s playback intervals.
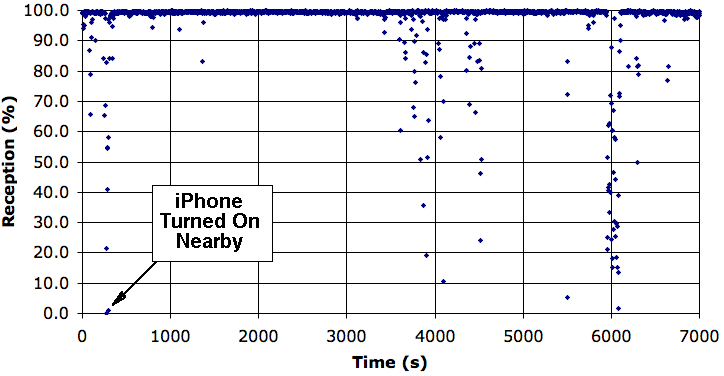
There are three periods of poor reception. The first is at around 300 s, where reception drops to zero for a few intervals. Sameer says, "Also the iPhone interference (done on purpose to reconfirm the finding) can be seen in the period t~270 to 300sec in file M1281643595." The second period is from 3500 s to 4500 s, when reception occasionally drops below 80%. The worste period is around 6000 s, when reception is below 80% most of the time for around 100 s.
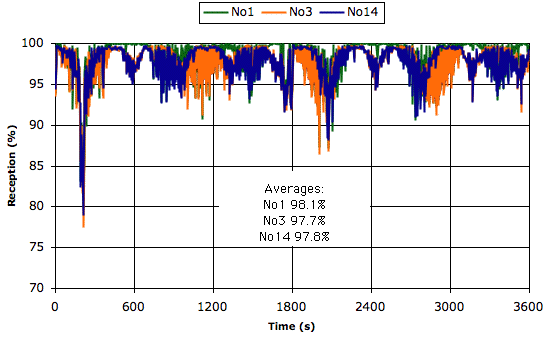
[18-AUG-10] Sameer recorded another six hours of data from No6, which has been re-implanted with screws in another animal. The data spans six hour-long archives. You will find a graph of reception versus time here. The first archive is M1281985381. Average reception is 98.3%. Robustness is 99.8%.
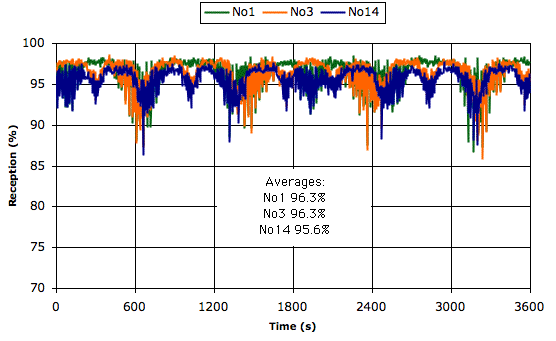
[25-AUG-10] Receive another six hours of data from Sameer at CHB, starting with archive M1282668620 and ending with M1282686620. The rat was less active and more asleep during these six hours. We plot reception here. Average reception is 97.6% and robustness is 97.6%. There are eight periods of poor reception, two of which see reception drop to zero. The first may be explained by the enclosure lid being improperly seated. We have no information about the cause of the other periods.
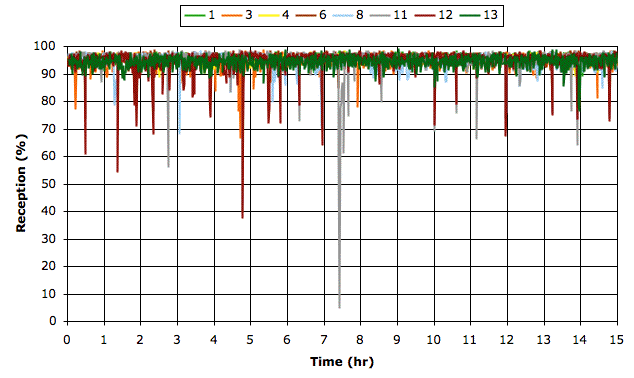
[23-SEP-10] We receive seven hours of recordings by Tsung and Yingpeng of CHB from two transmitters. Transmitter No1 is a new A3019A and No8 is an A3013A. Two hours are from 15-SEP and the remaining five from 16-SEP. We apply the TPSPBP processor to obtain characteristics and run the RA analysis in the Toolmaker to calculate reception and robustness. Transmitter No1 has average recption 94.5% and robustness 94.8%. Transmitter No8 has average reception 96.9% and robustness 98.3%. We see that the new, smaller transmitter perfroms slightly less well, but still satisfies our target of 95% robustness. Closer examination of the data shows that reception from No1 is weaker in the first hour, with robustness 89.7%, and stronger in the other six hours, with robustness 95.7%.
[24-SEP-10] We apply the RF analysis to the same characteristics files to look for reception failure. The analysis generates a list of events. Each event is reception dropping below 20%. We obtain 31 such events in all, of which are on No1, the A3019A. The two longest periods of reception failure are "M1284662749.ndf 768 1 22" and "M1284662749.ndf 860 1 6". The first one was loss of reception for a full 88 seconds. At the same time, No8 reception was robust.
[18-NOV-10] Today we discovered the importance of shielded cable for the connection between the Data Receiver and the LWDAQ Driver. An unshielded cable picks up interference and greatly aggravates the system. We switched to a shielded LWDAQ cable and performed tests upon this system. We have transmitter No7 in the lower enclosure, close to the antenna, so we are certain of a strong signal. We start with an A3015A with a 3-dB attenuator and record the number of messages in channel No7 each second, as well as the number of bad messages per second. After 200 s we remove the attenuator and record for another 200 s.
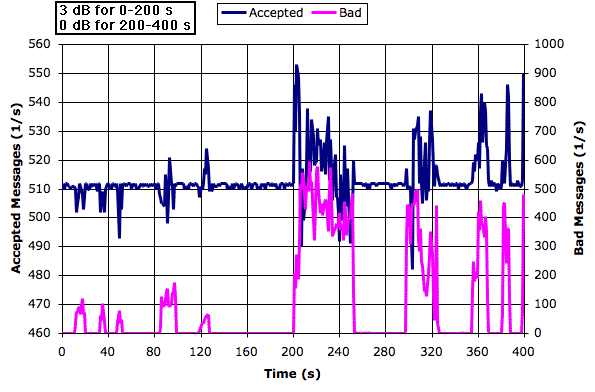
In the graph we see interference coming and going as some external source of 915-MHz power turns on and off. Interference generates bad messages. When we remove the attenuator, we see ten times as many bad messages during interference, and ten times as many such messages being accepted into the transmitter data.
The following series of tests explore the effect of attenuators, terminators, and interference. We start with the system shown here, with 3-dB antenna attenuators. In each case, we calculate reception by taking the average of ten one-second intervals. When we show the number of bad messages, we wait until the bad message rate jumps up and record at that time.
| Test | Configuration | Reception |
|---|---|---|
| 1 | No7 in FE2A near antenna | 99.3% |
| 2 | Disconnect FE2B | 97.1% |
| 3 | Terminate open socket | 99.3% |
| 4 | Remove 3-dB antenna attenuator | 100% |
| 5 | Restore 3-dB and rotate antenna loop | 97.2% |
| 6 | Move transmitter | 99.7% |
| 7 | Remove terminator | 99.6% |
| 8 | Reconnect FE2B | 99.7% |
| 9 | Remove 2 terminators on unused combiner sockets | 94.9% |
| 10 | Restore 1st terminator | 99.3% |
| 11 | Restore 2nd terminator | 99.9% |
| 12 | Remove 1st terminator | 99.5% |
| 13 | Remove 2nd terminator | 94.4% |
| 14 | Restore 2 terminators | 99.9% |
| 15 | Remove 2 terminators and 3-dB antenna attenuator | 99.8% |
| 16 | Move No7 to FE2B | 99.9% |
| 17 | Restore 2 terminators | 99.9% |
| 18 | Remove 3-dB atenna attenuator | 99.9% |
| 19 | Move transmitter until reception is weak | 76.6% |
| 20 | Put 3-dB attenuator at cage wall | 0% |
| 21 | Remove combiner and connect directly to data receiver | 99.7% |
| 22 | Remove 3-dB attenuator | 99.4% |
| 23 | Restore 3-dB attenuator to cage wall | 99.2% |
| 24 | Remove 3-dB attenuator, restore combiner | 67% |
| 25 | Replace combiner with 6-dB attenuator | 68% |
| 26 | Restore combiner, unshielded root cable | 42% |
| 27 | Add 3-dB attenuator to antenna, unshielded root cable | 0% |
| 28 | Remove combiner, unshielded root cable | 15% |
| 29 | Remove 3-dB attenuator, unshielded root cable | 90% |
| 30 | Move transmitter close to antenna, unshielded root cable | 88% + 500 Bad/s |
| 31 | Add 3-dB attenuator to antenna, unshielded root cable | 97% + 40 Bad/s |
| 32 | Remove 3-dB attenuator, unshielded root cable | 90% + 800 Bad/s |
| 33 | Restore shielded root cable | 100% + 100 Bad/s |
| 34 | Add 3-dB to antenna | 99.7% + 5 Bad/s |
Tests 1 to 18 show that when our signal is strong, unused combiner sockets should be terminated. In one case we see reception drop from 99% to 94% because of poor termination. In tests 19 to 25, the transmitter signal is barely strong enough for detection by an antenna without an attenuator. Adding any form of attenuation in the antenna cable causes reception to drop. The combiner affects the signal like a 6-dB attenuator.
In tests 26 to 29, we have a weak signal and an unshielded root cable. Between 24 and 26 the only change is removing the root cable shield. Reception drops from 67% to 42%, which may or may not be significant. But we see no dramatic increase in the bad message rate when our transmitter signal is weak and we remove the root cable shield. With no attenuator and no combiner, we get 90% reception.
In tests 30 to 34 we move the transmitter close to the antenna so that we have a strong signal. We start recording the bad message frequency. The source of these bad messages is suppressed both by the 3-dB attenuator and the shielded cable, and most of all by both acting together.
We conclude that a 3-dB attenuator in the antenna will improve reception when the transmitter signal is strong. When the transmitter signal is almost too weak to receive, the additional attenuator will degrade reception. We plan to overcome the degradation caused by the 3-dB attenuator in the future with the help of an active antenna combiner: the A3021.
The above experiments are closely related to our experiment with shielded and unshielded LWDAQ cables in the presence of a 3-dB antenna attenuator. A shielded cable decreases the bad message by a factor of ten. From the above experiments we see that a 3-dB attenuator on the antenna also decreases the bad message rate by factor of ten. When we remove the attenuator and the shield, the bad message rate increases by a factor of a hundred.
[19-NOV-10] Today we measured reception with random movement on the end of a stick within our FE2A enclosure. Our objective was to determine how the 3-dB attenuator affects reception and to better understand the source of bad messages in the OSI office. We have two transmitters: an A3013A without encapsulation, No7, and an A3019A with encapsulation, No1. We move and rotate the transmitter inside the cage for a minute and calculate the average reception, the robustness, and bad message rate.
| Test | Configuration | Reception | Robustness | Bad Rate |
|---|---|---|---|---|
| 35 | A3013A, 0-dB antenna, no combiner | 93% | 90% | <1/s |
| 36 | A3013A, 3-dB antenna, no combiner | 93% | 89% | <1/s |
| 37 | A3013A, 3-dB attenna, combiner | 84% | 74% | <1/s |
| 38 | A3013A, 3-dB attenna, combiner, FE2B added | 87% | 70% | <1/s |
| 39 | A3019A, 3-dB attenna, combiner, FE2B added | 78% | 53% | <1/s |
| 40 | A3019A, 0-dB antenna, no combiner | 92% | 82% | <1/s |
| 41 | A3019A, 3-dB antenna, no combiner | 94% | 92% | <1/s |
| 42 | A3019A, Turn absorber grey side up | 88% | 92% | <1/s |
| 43 | A3019A, Absorber black side up, put absorber fragments in receiver box | 94% | 93% | <1/s |
| 44 | A3019A, Repeat | 84% | 78% | 108/s |
| 45 | A3019A, Repeat | 91% | 80% | 234/s |
| 46 | Remove absorber from receiver. Turn off transmitter. | 0% | 0% | 500/s |
| 47 | Disconnect FE2A | 0% | 0% | 0/s |
| 48 | Restore FE2A, 6-dB attenuator at receiver box, 3-dB at antenna | 0% | 0% | 0/s |
| 49 | Remove 6-dB attenuator | 0% | 0% | 400/s |
| 50 | Remove antenna leaving 3-dB attenuator | 0% | 0% | 0/s |
| 51 | Remove 3-dB attenuator | 0% | 0% | 0/s |
| 52 | Restore antenna | 0% | 0% | 100/s |
| 53 | 3-dB at antenna enclosure | 0% | 0% | 0/s |
| 54 | Remove 3-dB from antenna enclosure | 0% | 0% | 10/s |
We see the bad message rate going up and down as we watch without altering the system. We try to wait until we see the rate go up before we make our measurement. Today we see high bad message rates even when the transmitter is off. The bad messages stop when we disconnect the antenna. They stop if we put 9 dB of attenuation between the antenna and the receiver, but not when we insert only 3 dB. Our observations are consistent with powerful interference entering the faraday enclosure and resonating between its walls. The poor performance of the FE2A is evident in our earlier experiments. The FE2A absorber is half as thick as the ones we settled upon for the FE2B, and is on the floor instead of glued under the lid.
[31-DEC-10] We left two transmitters running in two faraday enclosures for three hundred hours. Antennas are A3015Bs with 3-dB attenuators installed. Instead of an antenna combiner, we use a BNC T-junction at the Data Receiver. We obtain the following reception, averaged over each hour with the help Interval Analysis.
We also use analysis to search for periods when reception drops below 90%, and find that this occurs during only one twenty-second period during the three hundred hours. During this twenty-second period, reception drops to zero for both transmitters.
[10-JAN-11] We incorporate an Antenna Combiner (A3021B) into our system. This combiner has amplification before combination. We plug the antennas into the combiner. We do not terminate the unused combiner inputs. We obtain the following reception. We note that No9 has not moved since the T-Junction experiment.

We see that reception is substantially improved with the introduction of the active antenna combiners. We searched for periods of poor reception and found two. We examined the raw data in the Neuroplayer and found that both eight-second periods of poor reception contain thousands of bad messages.
We see that the antenna attenuator, the active antenna combiner, and the shielded root cable together reduce the frequency of these bad-message failures from once every few minutes to once every few days.
[27-JAN-11] Joost at ION sets up a four-enclosure system with our new A3015B antennas and our new A3021B antenna combiner. One of his antenna cables is ten meters long. He places twelve transmitters in his cages. He says, "I tested all transmitters in the setup you suggested. I have attached two characteristics files. The first with all transmitters close to the antennae and the second with the transmitters in the corners of the enclosures. Transmitter 9 is implanted, the rest is not."
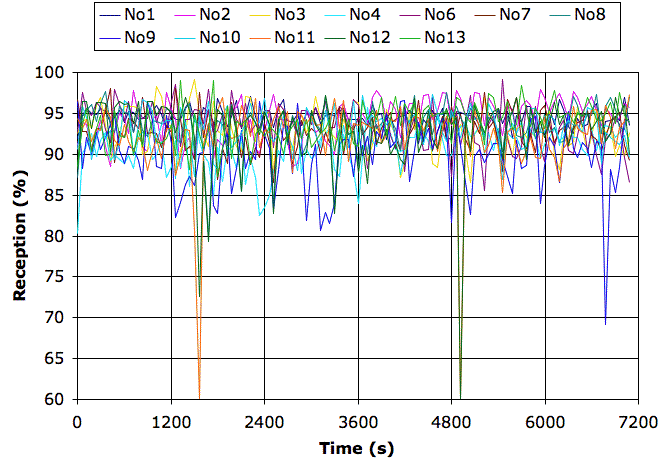
Average reception is greater than 90% for all twelve. According to our simulations, collisions alone will lower the average reception from twelve transmitters to 92%, with an occasional minimum of 52% and average robustness of 97%. Robustness for the twelve transmitters over two hours, as measured in four-second intervals, is as follows: No1 100.0%, No2 99.9, No3 99.9%, No4 98.9%, No6 99.7%, No7 99.9%, No8 99.3%, No9 95.2%, No10 99.9%, No11 95.4%, No12 96.5%, No13 96.8%. In short: reception is superb. Our target is 95% robustness with 8 transmitters.
[22-FEB-11] Rob at ION sends us recordings in M1298209850 from three implanted transmitters in a four-cage system. Reception is 98% or higher for all three transmitters. We see occasional reception drops in reception, and these tend to affect to transmitters at a time.
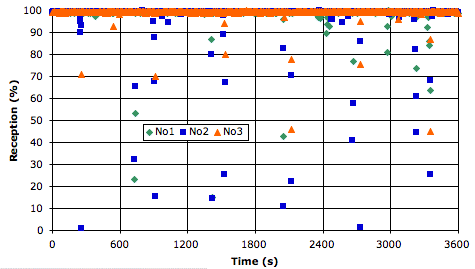
The coincidence of reception drops suggests external interference is causing the drops, but we see no bad messages in the data during the drops.
[14-MAR-11] While at CHB, we noticed reception failure from an implanted transmitter. We lifted the lid of the faraday enclosure. Reception returned to near 100%. We replaced the lid, reception dropped to near zero. We touched the mesh walls. Reception recovered. We opened the cage and moved the antenna 10 mm. Reception was robust again. The animal was near a metallic wall of the cage, with the antenna on the far side of the wall. We rotated the cage so that the antenna would never have metal in the line of sight transmission. We did not observe drop-out again that day.
[03-APR-11] We receive from Joost 15 hours of recordings from control animals at ION. The recordings were made on 13-FEB-11 with four faraday enclosures, eight animal cages, an A3021B active antenna combiner, and an A3018C data receiver. The following graph shows minute-by-minute reception during the entire 15 hours.
Average reception ranges from 94.4% to 95.7%. We expect a loss of 5% from collisions, so we are well-satisfied with the system's performance. There is one period of a minut on No11 when reception drops almost to zero. Other than that, a more detailed search through the data shows hourly drops below 20% reception lasting around ten seconds.
[28-JUN-11] We repaired and returned Louise's A3018C Data Receiver, and she tried it out again in her laboratory with three transmitters and no faraday enclosure. Here is reception for an hour. We see periodic collisions between pairs of transmitters. At time ≈200 s we see reception from all three transmitters dropping from external interference. Maximum reception is 100% and minimum is 77%.
Louise and Lukasz took the Data Receiver down to their animal building and recorded from the same three transmitters on plastic cups in a faraday enclosure. Here is reception for one hour. We see the periodic collisions between pairs of transmitters that we expect. Minimum reception of around 86% occurs when all three transmitters collide at the same time. Maximum reception, however, is only 98%.
We examined the signal at time 500 s, when collisions are at a minimum. Roughly 2% of the messages are missing. The missing messages are distributed at random. There are no bad messages.
[21-JAN-20] We receive 144 hours of EEG from Cornell recorded by A3028P1-AA in a mouse. Random checks of reception during the 144 hours show 100.0%. Analysis of first hour in one-second intervals gives average reception 99.998%.
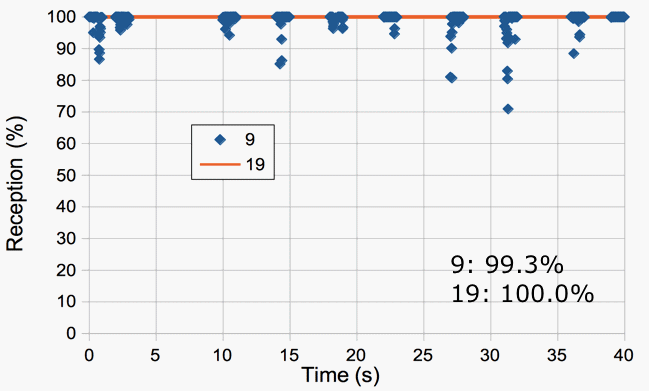
[12-FEB-20] We receive EEG recordings from Taiwan of two transmitters in a locally-made Faraday Enclosure, see here. One transmitter, No19, acts as a reference in the left-hand cage. The other transmitter, No9, is an A3028E-AA implanted in a rat in the right-hand cage. We have recordings from three arrangements of the two antennas in the enclosure.
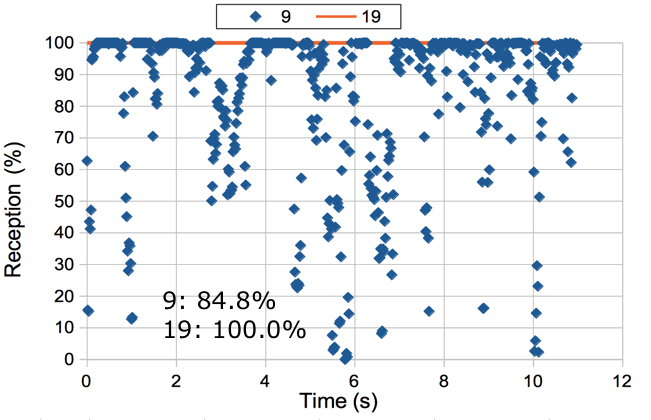 Figure: Reception with Antennas Against Left and Right Walls of Locally-Made Faraday Enclosures in Taiwan.
In the plot above, reception drops as the animal moves away from the nearby right-wall antenna. We now have one antenna in the center of the enclosure, between the two cages, and one near the right wall, so that the two antennas are on either side of the cage containing the animal.
With the two antennas centered, we obtain the following reception over a three-day period.
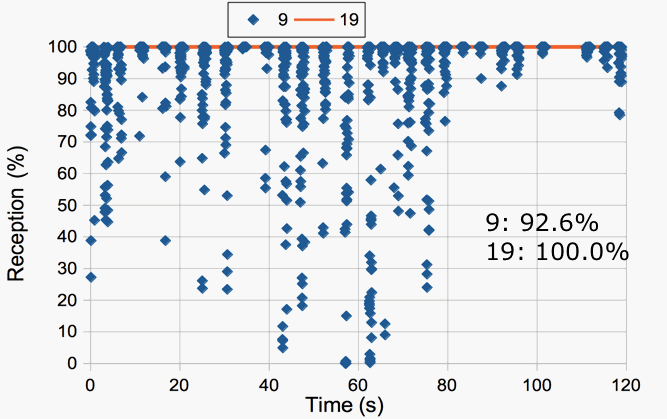
Reception is poor unless we have an antenna on either side of the animal cage, in which case it is excellent.
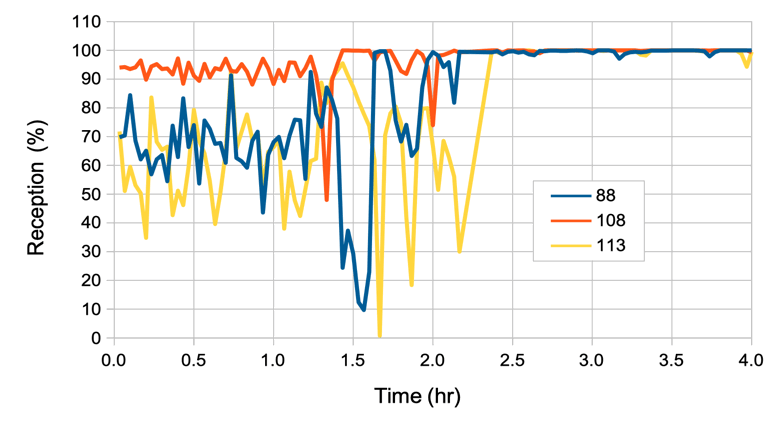
[24-JUN-21] We receive five hours of recordings from UCB Pharma, where they have three A3028P1-AA-C37-C transmitters implanted in mice in a set of four FE3A enclosures. Each FE3A is equipped with four Wisenet X-Series XND-6080 video cameras and four A3015C loop antennas connected to an Octal Data Receiver. Each antenna shares a data receiver input with another antenna in another FEW3A by means of a BNC T-Adaptor. During the first three hours, their video cameras on the back walls of the enclosures are powered up, running, and not covered with steel mesh, while the cameras on the ceiling are covered with mesh. During the final two hours, the back wall cameras have been disconnected from power.
To obtain the above plot, we processed 8-s intervals with a processor script consisting of only one line:
append result "$info(channel_num) [format %.2f [expr 100.0 - $info(loss)]] "
We applied our reception averaging interval analysis to the characteristics files generated by the above processor, and so obtained the average reception per minute for the entire 120-minute recording. The camera interference stops at time 2.4 hr. From that time onwards, reception for the three channels is 99.6%, 99.9%, and 99.7%. Our customers at UCB Pharma tell us that the disruption of reception by the cameras on the ceiling before they were covered with mesh was even greater. The ceiling cameras are equipped with infrared lamp arrays. We hypothesize that it is the camera power supplies that are generating microwave noise that interferes with reception of SCT signals.
[08-SEP-21] We have three hours of recordings from UCB from each of two recording systems. Each recording system consists of four FE3AS enclosures, sixteen antennas, and one Octal Data Receiver. There are 47 transmitter in all, we process all six hours and write reception to disk. Median reception is 99%, mean is 98%. We count the number of 8-s intervals in which reception is less than 80% for all channels using code below.
set fnl [LWDAQ_get_file_name 1]
set histogram [list]
foreach fn $fnl {
	set f [open $fn r]
	set contents [split [string trim [read $f]] \n]
	close $f

	foreach interval $contents {
		foreach channel [lrange $interval 2 end] {
			set index [lsearch -index 0 $histogram $channel]
			if {$index >= 0} {
				set count [expr [lindex $histogram $index 1] + 1]
				set histogram [lreplace $histogram $index $index "$channel $count"]
			} else {
				lappend histogram "$channel 1"
			}
		}
	}
}

LWDAQ_print $t "Found loss in [llength $histogram] channels."

set histogram [lsort -increasing -index 0 $histogram]
foreach record $histogram {
	LWDAQ_print $t $record
}
There are 22 channels of 47 with loss in at least one interval. Two have loss more than 10% of the time: No185 at 15%, No187 at 18%. During loss periods, reception is almost always greater than 60%.
[12-NOV-21] We have four hours of recording from each of four Animal Location Trackers (A3038B) each with one animal with an SCT, and three with another animal without an SCT. We have continuous top-down video from all three cages. We plot reception below.
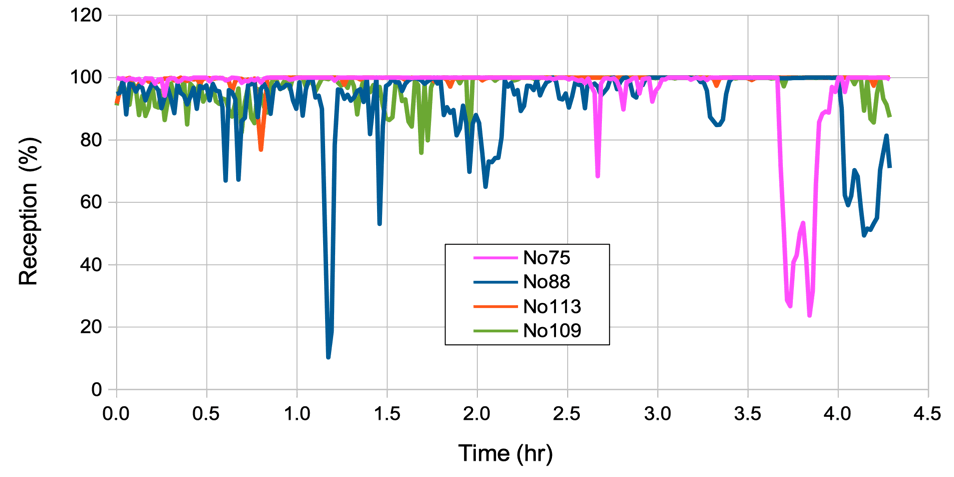
Reception from the C-Antenna is adequate. Reception from the D-Antenna is almost perfect except for a ten-minute period when it drops to 25%. The ALTs provide average background power measurements for the 900-930 MHz band. Average background power is 57 counts, which for the A3038DM-C detector modules of the A3038B is around −63 dBm. During the ten-minute loss, the animal No75 is completely still. Two detectors receive power 98 counts, or −50 dBm, which should be adequate for reception, it being 13 dB above background. When we visited UCB in November 2019, we found it was interference generated by their cameras that was disrupting reception with their Octal Data Receiver. There are four cameras in each Faraday enclosure. But when we measured 850-1000 MHz interference in the enclosures with our spectrometer (A3008), we found none. We were able to improve reception dramatially by covering all cameras with stainless steel mesh. The UCB engineer later observed that it was the cameras providing illumination that caused the greatest disruption, and suggested that it was the lighting power supply that was generating the noise. We agree with this suggestion. The cameras are power over Ethernet (PoE), so contain 48-V converters. These can produce powerfule 100-ns electromagnetic pulses that would not be detected by our ALT power measurement or our spectrometer, and yet would distrupt one or more bits of an incoming SCT message. If so, the loss would be random rather than complete, and ALT activity measurement through SCT power reception would remain accurate even when we are receiving only 15% of the messages. We find this is indeed the case: the ALT sees the animal as stationary.
[06-DEC-21] We install eight antennas into an FE5A Faraday Canopy, feeding the cables into the enclosure through an 8-to-4 Coaxial Feedthrough (A3039C). The feedthrough combines eight interior antenna signals into four exterior signals.
| Number of Antennas | Reception |
|---|---|
| 0 | 2% |
| 1 (unpaired) | 75% |
| 2 (unpaired) | 85% |
| 3 (unpaired) | 97% |
| 4 (unpaired) | 99% |
| 5 (paired with 1) | 100% |
| 6 (paired with 2) | 100% |
| 7 (paired with 3) | 100% |
| 8 (paired with 4) | 100% |
The antennas are arranged on the face of the absorbers on the left and right wall of the canopy.
[13-MAR-22] We receiver three hours of recording from four A3028C transmitters implanted in mice in an IVC rack within an inner room at University of Manchester, see here. The building is brick, and we assume the walls of this inner room, which has no windows, are likewise made of brick. The door is a fire door, which we assume is made of metal. There is no Faraday enclosure around the rack, and yet we obtain near-perfect reception, average 99.4% and higher.
[15-MAR-22] We receive recordings from Marsaille, where we have an ALT in an FE3A enclosure, and reception is around 50%. Upon obtaining latitude and longitude of their recording room, on the top floor of their building, we consult the Open Cell ID database and find two nearby mobile phone base stations, one immediately on top of their room, and another some fifty meters away.
According to GSMArena, the mobile phone networks in France are as follows. We have GSM for "global system for mobile", UMTS for "Universal Mobile Telecommunications Service", LTE for "long term evolution", and 5G for "5G". The numbers in parenthesis are band numbers, which we can use to look up the exact frequency ranges.
2G: GSM 900, GSM 1800
3G: UMTS 900, UMTS 2100
4G: LTE 700 (28), LTE 800 (20), LTE 1800 (3), LTE 2100 (1), LTE 2600 (7)
5G: 5G 2100 (1), 5G 3500 (78)
The L tower was last measured by the mapping agency in 2015. It is right on top of the animal laboratory. The G tower was last measured in 2021. It is seventy meters from the laboratory. Our telemetry system uses 900-930 MHZ. The LTE 800-MHz band is 832-862 MHz. The GSM 900-MHz band is 880-915 MHz. Both use 1800 MHz, LTE in the range 1850-1910 MHz, and GSM in the range 1805-1880 MHz. The GSM transmitter appears to be facing away from the laboratory. At range 70 m, assuming 1 kW power, if it radiated in all directions equally, its power would be 16 mW/m2. Base station antennas typically focus 30% of their power into their narrow beam, so we are left with 5 mW/m2 in the laboratory. Our FE3A enclosure provides at least 25 dB isolation for 900-930 MHz, dropping the power in the enclosure to around 15 μW/m2. On of our ALT antennas, with a 3-cm diameter for collection, will pick up no more than 15 nW, or −48 dBm. Our telemetry should function adequately with this as a maximum interference power. The LTE station at 1800 MHz is no more than 10 m away. The isolation of the FE3A we assume is similar to that of our FE2F, which we measured here. At 1800 MHz the isolation is around 15 dB. Assuming the laboratory is out of the beam of the LTE transmitter, we arrive at 500 times as much power at our antenna, or −20 dBm. We find that the A3038DM-C detector module is vulnerable to 1800-1860 MHz. The DM-C can detect a −43 dBm SCT signal with at most −20 dBm of 1825 MHz. At 1875 MHz, it can tolerate +7 dBm. By ALT standards, −43 dBm a typical maximum coil power from an implanted tranmitter. If the animal moves off the platform, a maximum of −53 dBm is possible, in which case we would lose reception. With an additional 900-930 MHz filter to the antenna cable, however, our tolerance for interference increases to +10 dBm for 1800-1900 MHz.
[21-MAR-22] At Marseille, our collaborators try a Damped Loop Antenna (A3015C) plugged into the auxiliary antenna input of their two A3038C ALTs.
We insert into the antenna cable a 902-928 MHz band-pass filter, CBPFS-0915, as shown here, making a Filtering Loop Antenna. We record for one hour from both ALTs.
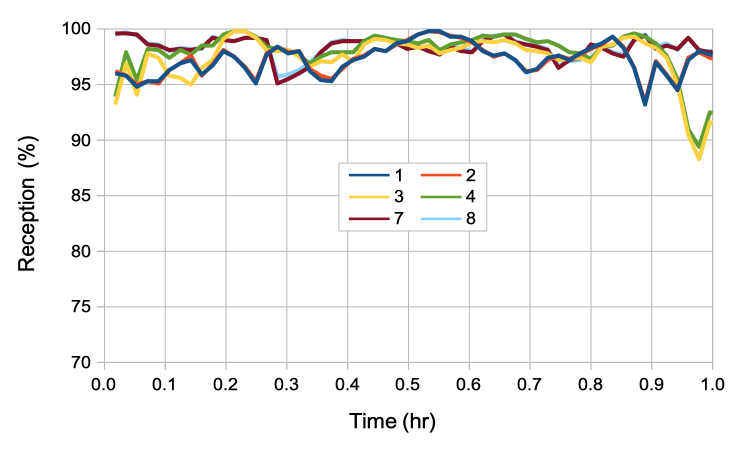
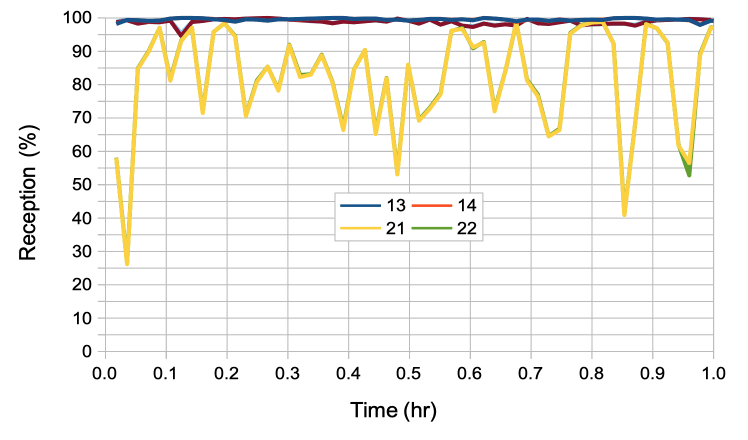
The table below gives average reception from each of the ten available channels with and without the filter.
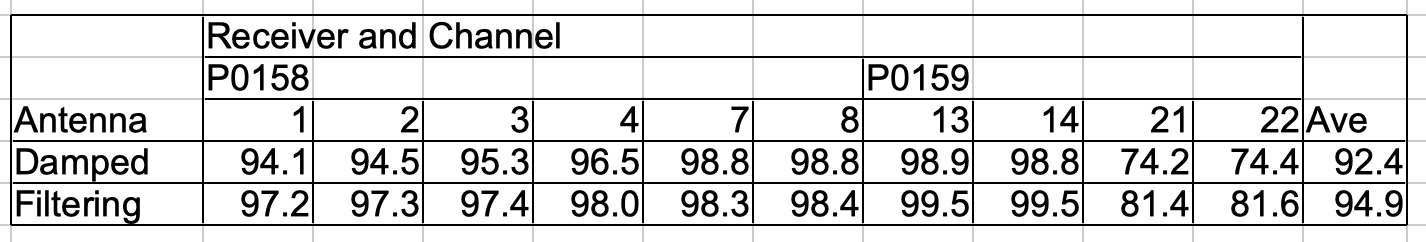
If we ignore transmitter 21/22, the average reception is around 98%.
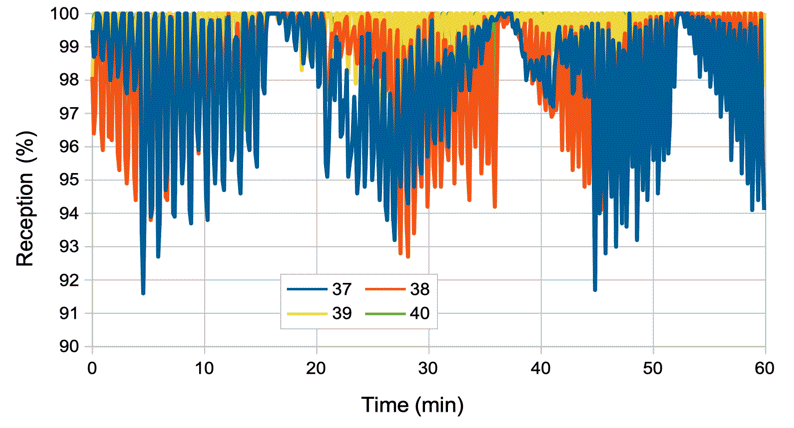
[27-APR-22] We receive two hours of recording from A3028S2-AA-C50-C transmitters implanted in mice at UCB, recorded from A3038B/C animal location trackers (not sure if it's a B or C version). There are three mice over each ALT. These transmitters are equipped with the 13-mm helical C-Antenna.
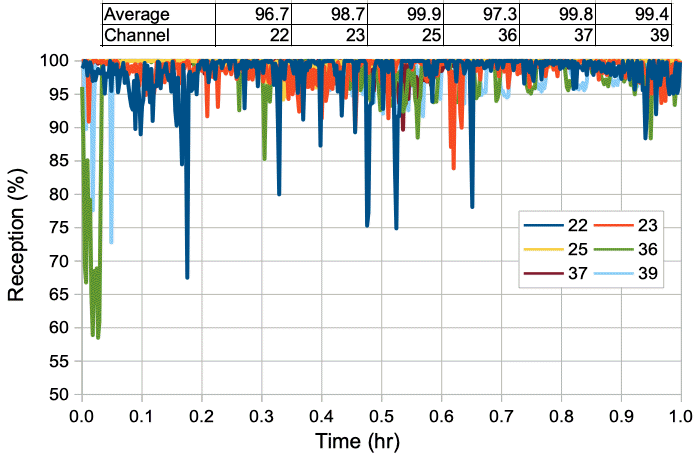
Reception from transmitters 36, 37, and 39 exhibit a rare alignment of their transmit clocks. All three transmitters collide for half an hour. We see cyclic loss of reception as a result of the collisions. For an explanation of how these cyclic losses arise, see Collisions.
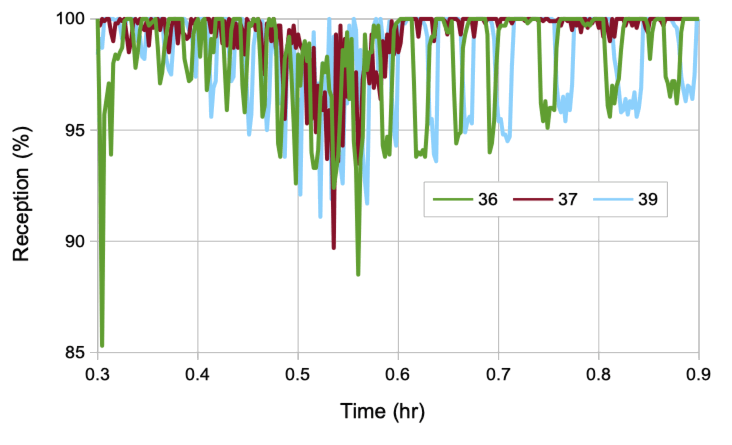
In order for three transmitters to collide, all three of their signals must arrive at the receiving antenna. In the case of the ALT, there are many receiving antennas. If the mice are separated, their signals will be received by a different set of antennas, and collisions are unlikely. Only when the mice are close together will their transmissions be received by the same set of antennas with similar strength. We examine the location tracking and find that during this half-hour, the three mice are indeed close together, moving occasionally, but mostly stationary.
[22-JUN-22] We compare the performance of various combinations of antennas in an FE5A Faraday canopy. We have a total of eight A3015C loop antennas, four on the left bank of absorbers and four on the right bank of absorbers. We move a transmitter around the entire volume of the enclosure and measure average reception for each configuration. When we combine antenna, we do so with an 8-to-4 Coaxial Combiner (A3039C).
| Number of Antennas | Antenna Configuration | Reception |
|---|---|---|
| 1 | One Independent | 83.2% |
| 2 | One Combined Pair | 81.1% |
| 2 | Two Independent | 96.1% |
| 3 | Three Independent | 99.0% |
| 4 | Two Combined Pairs | 84.7% |
| 4 | Four Independent | 98.3% |
| 6 | Three Combined Pairs | 99.7% |
| 6 | Six Independent | 100.0% |
| 8 | Four Combined Pairs | 100.0% |
| 8 | Eight Independent | 99.9% |
[11-JUL-22] At UCB, we have four A3028S2-AA-C50-D transmitters implanted in mice. Two are in one cage over one ALT. Two are in another cage over another ALT. Both cages are in the same FE3A Faraday enclosure. We receive two hours of recording from each ALT. These transmitters are equipped with the new 30-mm thin loop D-Antenna. Average reception from the four transmitters in the four separate archives is as follows.
Archive         No86    No88    No91    No92
M1657184483.ndf 93.0    87.0    99.1    99.5
M1657184534.ndf 99.4    99.8    81.4    86.2
M1657188084.ndf 95.9    85.3    99.3    99.3
M1657188135.ndf 99.7    99.8    84.7    82.8
Our collaborators at UCB confirm that No86 and No88 are over one ALT while No91 and No92 are over another. Reception from the D-Antenna over an ALT is >99%. Reception from mice over a neighboring ALT is >80%.
[04-AUG-22] We receive a screen shot of signals recorded from a rat at Marseille using the modified A3038D with no auxiliary antenna attached. Reception is around 90%, with loss in chunks of up to thirty seconds at a time, see here. Our best guess is that there is 900-MHz interference in addition to 1840 MHz from the base station on their roof.
[14-SEP-22] We have recording M1647868967.ndf made at Marseille on 21-MAR-22. The data receiver is ALT P0159, version A3038C. It is equipped with a damped auxiliary antenna (A3015C). The auxiliary antenna has no coaxial bandpass filter. We compare background power, signal power, and reception. The background power is available in the channel No0 signal. We use the maximum background power seen in the fifteen detector coils as our measurement of background power. We ignore the power in the auxiliary antenna. We obtain the maximum signal power from the same fifteen detector coils. We use SCT channel No13 implanted in a rat for our signal power and reception measurements.
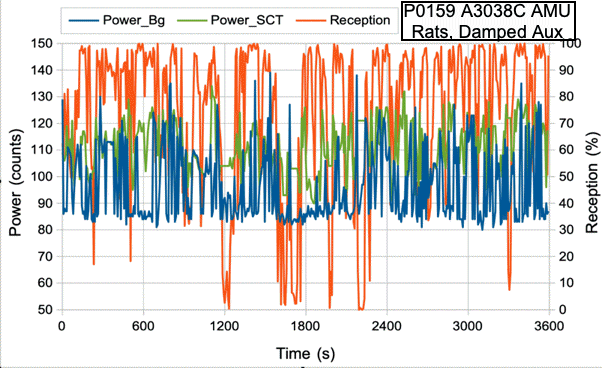
Here we are seeing background up to 140 cnt, far higher than the 80-count background we see in our own enclosures. It is this powerful and variable background power that motivates us to design the A3038D, where each detector coil has a 902-938 MHz bandpass filter in its short detector cable.
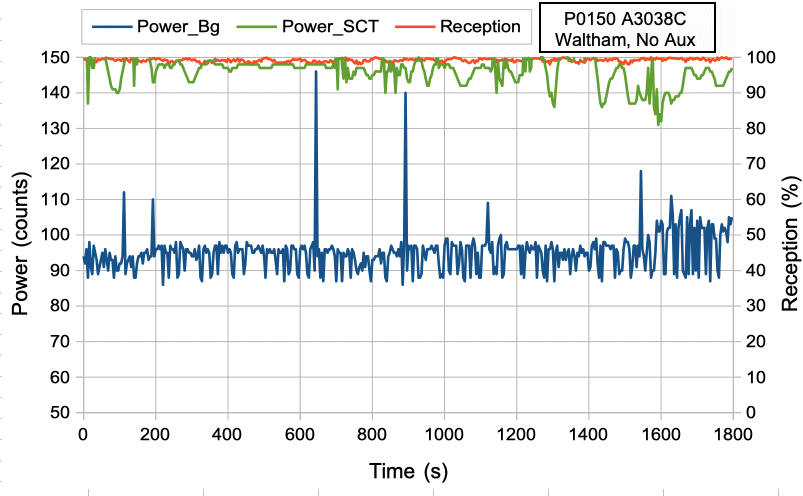
Today, in the OSI Faraday canopy, we record from P0150, an A3038C, with no auxiliary antenna. We have five transmitters on a pendulum swinging 50 cm above the platform. We agitate the pendulum every few minutes to keep the transmitters moving. We keep the canopy sealed until 1600 s, then open it from 1600-1800 s. We concentrate on No20. All transmitters are in air.
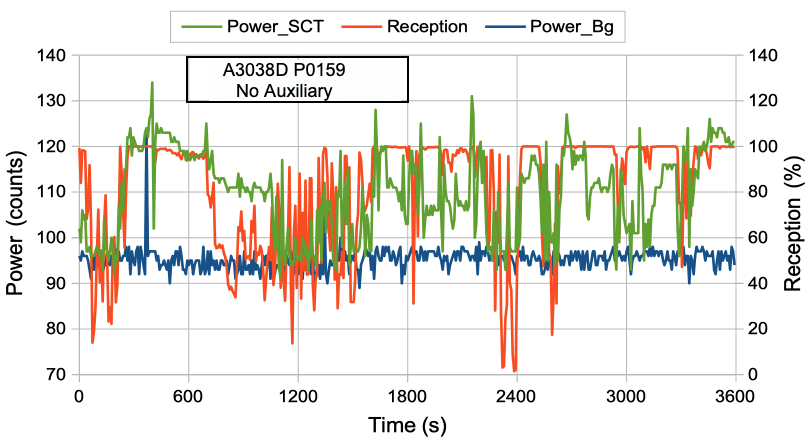
We have recording M1659126880.ndf from Marseille, 29-JUL-22, from P0159, now A3038D enhanced with coaxial filters in series with all detector coils. No auxiliary antenna. We follow transmitter channel No25 implanted in a rat. Compared to March, background power is low and stable. But signal power varies greatly.
We perform the same measurement for channel No25 in M1661115196.ndf recorded on 21-AUG-22 with P0160 A3038C equipped with filtering auxiliary antenna (902-928 MHz bandpass filter in auxiliary antenna cable). The No25 SCT is implanted in a rat. We see background power is low and stable in P0160, even though it has no filters on its detetor coil cables.
Here is the same measurement obtained from M1657188084.ndf recorded from an A3038C in Brussels. We use SCT No91, implanted in a mouse, for our reception and signal power.
[09-NOV-22] We have five hours recorded from ALT A3038C number P0157 from A3028E No122 implanted subcutaneously in rat W856. We have another five recorded from ALT P0160 from A3028E No65 implanted in W857. Reception is in both cases 99.8% on average.
Both ALTs are operating without coaxial filtering, nor an auxiliary antenna. The animal is moving freely. The leads are cut short to 4 cm and implanted under the skin with the transmitter. These two implantations are to test reception only.
[16-DEC-22] We have four A3028G3Z implanted in Marseille. We are recording with A3038C number P0157 and A3038D number P0160. Average reception for No41, No55, No51, and No53 are 99.0%, 99.2%, 99.3%., and 98.9%.
Loss of signal occurs because of collisions between the two transmitters over each ALT. The ALT is capable of receiving only one message at a time, while the ODR and TCB can receive eight and sixteen messages simultaneously. We see no sign of loss due to any cause other than collisions.
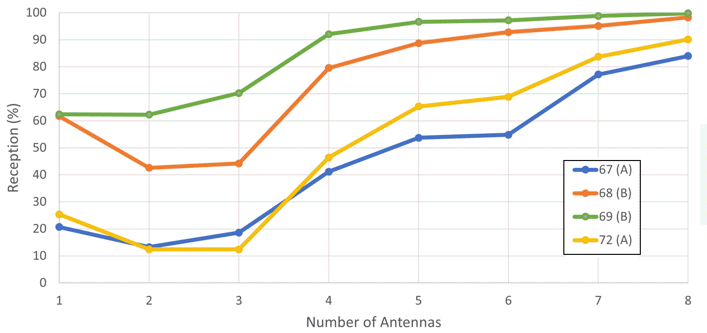
[10-JAN-23] We measure reception versus number of antennas in a Faraday Canopy (FE5A). There are eight A3015D loop antennas against the absorbers on the back wall of the enclosure. Each is connected to a separate input on a TCB-A16. We have six transmitters on a stick that we move around over an array of eight antennas on the four absorbers on the back wall of the enclosure. We have various numbers of antennas on the back wall connected to a Telemetry Control Box (TCB-A16). All six transmitters are identical: A3028C-AA-B45-B, equipped with 30-mm loop antenna.
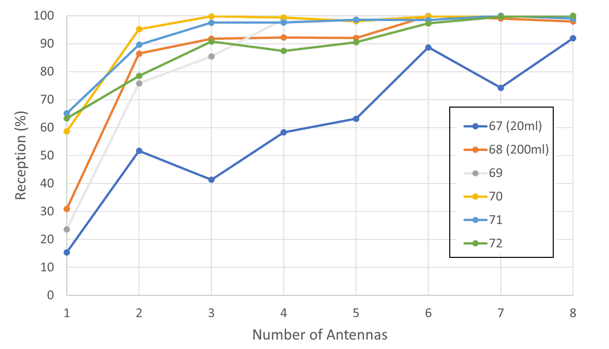
Note the poor reception we obtain from the tranmitter in 20 ml of water. We have observed poor reception in mouse-sized bodies of water before, see here.
[19-JAN-23] We embed four A3028C transmitters in gelatin, placing two against the wall of a cup and two at the center of the base of a cup, then pouring 20 ml of gelatin with 1% saline into the cup, covering the transmitters completely.
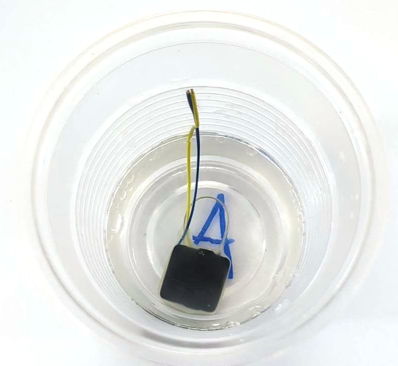
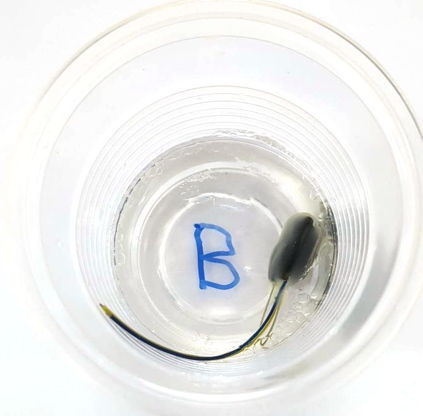
We attach the four cups to a stick and rotate and translate randomly in our FE5A canopy, measuring reception with increasing number of antennas connected to our TCB-A16.
[20-JAN-23] We compare the power received from model A and B gelatin. We place the cup on an A3015D antenna and rotate. Cup upright, cup upside down, cup resting sideways.
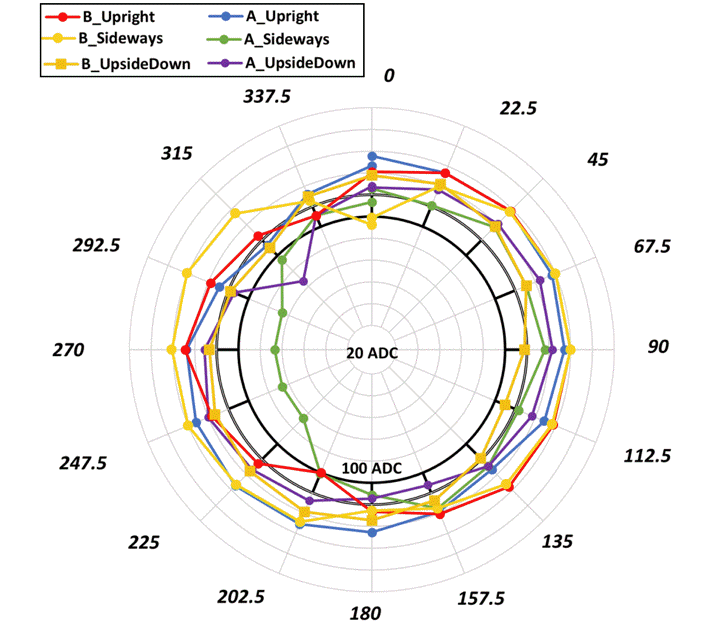
The Model A is more directional and overall emits less power than the Model B.
[23-JAN-23] We consider how the number of independent antennas will affect reception in the ideal case where every antenna's reception is independent of every other antenna's reception, and the probability of reception at any one antenna is equal to that of reception at any other.
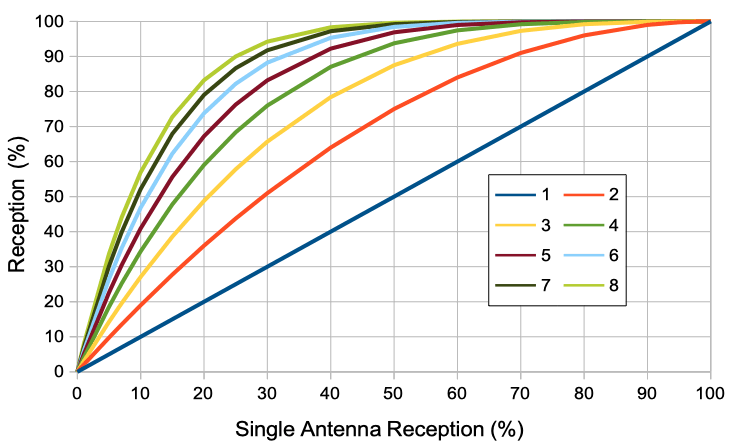
Our measured plots of reception are similar in form to the ideal plot above.
[10-FEB-23] We have two hour-long recordings from A3028G3Z implanted in rats at AMU over A3038C1 ALTs. This is the location we previously believed was plagued by 1840 MHz interference from a roof-top base station. The roof-top base station exists, but our earlier problems with reception appear to have arisen from three other causes: a detector module out of place in its socket on P0159, implanting deep within the rat's body rather than subcutaneously, and a transmitter clock drifting our of tolerance.
Average reception in both recordings from all channels is 99.5%. Loss is dominated by collisions between the transmitters, which proceed in cycles of period dictated by differences in their clock frequencies: the larger the difference in frequency, the more rapid the cycles.
[08-MAR-23] We implant two A3028C2 transmitters in agar. One is implanted in the center of a mouse-sized body of agar, the other on the surface.
We receive with four antennas attached to a TCB-A16 in an FE5A canopy, rotating at random. We obain 98% reception from our control transmitter in air, 64% from the subcutaneous implant simulation, and 75% from the deep-body simulation.
[28-MAR-23] We have two hours of recordings from two separate ODRs in the same Faraday canopy at ION. This canopy is the one we upgraded in Summer 2021, adding feedthroughs and the aluminum sheet floor. It still has aluminum walls at the side and back with absorbers. Our collaborators repaired tears in the seams with tape today, and added handles, see here.
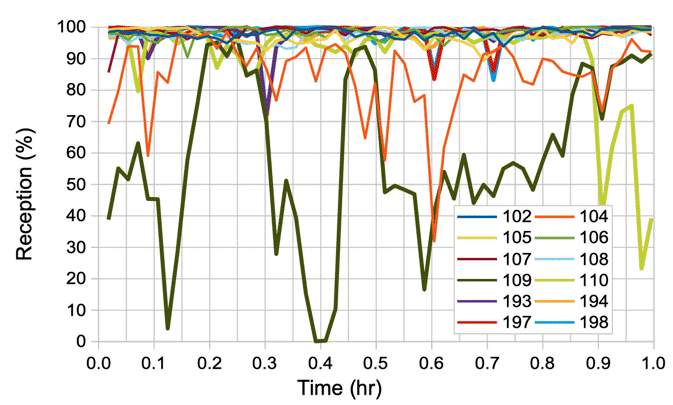
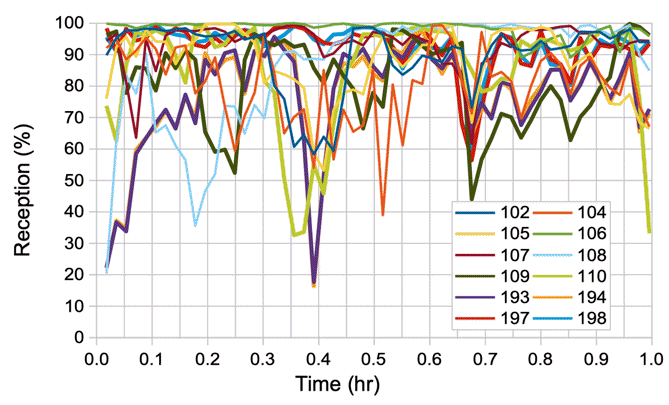
Average reception for the two receivers is:
Channel	102	104	105	106	107	108	109	110	193	194	197	198
Right	90.1	80.4	87.4	98.2	93.3	86.2	81.9	85.5	76.8	76.7	92.4	92.7
Left	98.0	85.0	97.0	98.3	98.4	97.6	81.9	90.8	98.0	97.7	98.5	98.5
We speculate that the transmitters are closer to one set of antennas than the other. But No104 and No109 still have reception barely over 80% from both receivers.
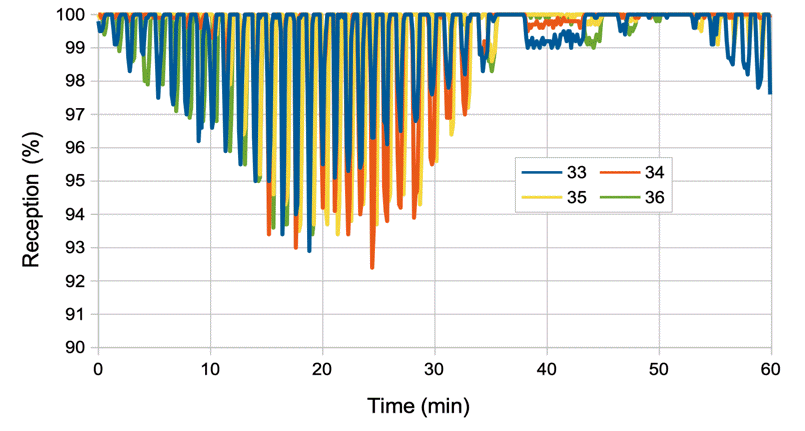
[02-SEP-23] We have six hours of recordings from three A3049H2, dual-channel transmitters with 30-mm stranded loop antennas, implanted in mice, recorded by a TCB-A16. The recordings are continuous for three hours, then there is a gap of three hours, and another three hours of recording. We calculate average reception per minute and plot, ignoring the gap.
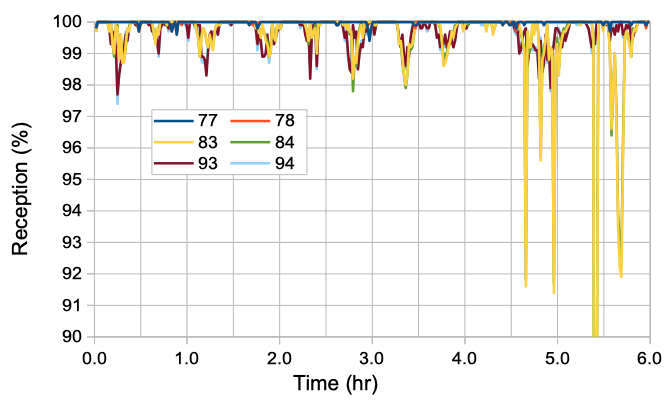
Overall average reception is 99.4% to 100% for all channels. There are nine antennas connected to the TCB, arranged around two columns of cages in an IVC rack, as shown here. The recordings are being performed on the top floor of a brick building in Manchester. The recording room is in the center of the building with brick walls and no windows. There is no Faraday enclosure.
[06-SEP-23] We find that reception from our new A3049A3 mouse transmitters in air is poor when recording with a Telemetry Control Box (TCB-A16) or Animal Location Tracker (A3038C), but adequate with an Octal Data Receiver (A3027E). With old A3028C2 and recent A3048S2 mouse transmitters we obtain near-perfect reception in air. We select some transmitters and measure their output power spectra by placing them at the center of a horizontal A3015C damped loop antenna on our work bench. We record the peak of each spectra as our measurement of received power in dBm. We have a small plastic dish with 20 ml of water in it to mimic the body of a mouse.
| Serial Number | Part Number | Transmit Antenna | Matching Network | Environment and Orientation | Power (dBm) |
|---|---|---|---|---|---|
| S228.101 | A3048S2 | 30-mm Thin Loop | 2nF | air 0-deg face-up | -31 |
| S228.101 | A3048S2 | 30-mm Thin Loop | 2nF | air 0-deg face-down | -31 |
| S228.101 | A3048S2 | 30-mm Thin Loop | 2nF | air 90-deg face-up | -28 |
| S228.101 | A3048S2 | 30-mm Thin Loop | 2nF | air 180-deg face-up | -30 |
| S228.101 | A3048S2 | 30-mm Thin Loop | 2nF | air 270-deg face-up | -29 |
| S228.101 | A3048S2 | 30-mm Thin Loop | 2nF | 20-ml water 0-deg face-up | -40 |
| S228.101 | A3048S2 | 30-mm Thin Loop | 2nF | 20-ml water 90-deg face-up | -35 |
| S228.101 | A3048S2 | 30-mm Thin Loop | 2nF | 20-ml water 180-deg face-up | -43 |
| S228.101 | A3048S2 | 30-mm Thin Loop | 2nF | 20-ml water 270-deg face-up | -36 |
| A202.153 | A3049A3 | 30-mm Loop | 15p/200R/15p | air 0-deg face-up | -31 |
| A202.153 | A3049A3 | 30-mm Loop | 15p/200R/15p | 20-ml water 0-deg face-up | -35 |
| A202.153 | A3049A3 | 30-mm Loop | 15p/200R/15p | 20-ml water 90-deg face-up | -33 |
| A202.153 | A3049A3 | 30-mm Loop | 15p/200R/15p | 20-ml water 270-deg face-down | -34 |
| A202.123 | A3049A3 | 30-mm Loop | 15p/200R/15p | air 0-deg face-up | -33 |
| A202.123 | A3049A3 | 30-mm Loop | 15p/200R/15p | 20-ml water 0-deg face-up | -33 |
| C227.67 | A3028C2 | 30-mm Loop | none | air 0-deg face-up | -25 |
| C227.67 | A3028C2 | 30-mm Loop | none | 20-ml water 0-deg face-up | -44 |
| C227.67 | A3028C2 | 30-mm Loop | none | 20-ml water 90-deg face-up | -53 |
| C227.67 | A3028C2 | 30-mm Loop | none | 20-ml water 180-deg face-up | -39 |
| C227.67 | A3028C2 | 30-mm Loop | none | 20-ml water 270-deg face-up | -37 |
| C227.41 | A3028C2 | 30-mm Loop | none | air 0-deg face-up | -32 |
| C227.41 | A3028C2 | 30-mm Loop | none | 20-ml water 0-deg face-up | -38 |
| C227.41 | A3028C2 | 30-mm Loop | none | 20-ml water 90-deg face-up | -37 |
| C227.41 | A3028C2 | 30-mm Loop | none | 20-ml water 270-deg face-down | -44 |
| A202.153 | A3049A3 | 30-mm Loop | 15p/200R/15p | 20-ml water 270-deg face-down | -36 |
| A202.153 | A3049A3 | 30-mm Loop | 15p/200R/15p | 20-ml water 90-deg face-up | -35 |
The "2nF" and "none" matching networks can produce ten times as much power in air, but their power drops by up to 20 dB when placed in 20 ml of water. Received power is a strong function of orientation for the "2nF" and "none" networks when in water. The "15p/200R/15p" network, which we are now loading onto all our transmitters, provides roughly the same power in or out of water, with no significant variation with orientation. The "15p/200R/15p" network appears to act more like an omnidirectional antenna in air and water, which is very much to our liking. Furthermore, this new matching network provides protection for the transmitter against static damage during assembly.
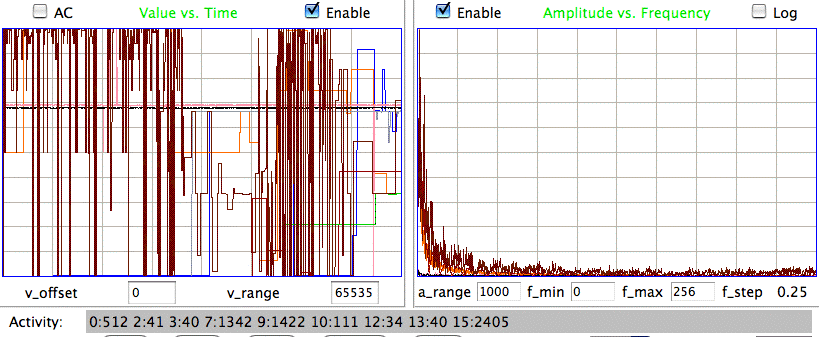
Nathan studies interference tolerance of TCB and ODR. He reports as follows. "I attempted to perform QC3 on some TCBs last week and we realized that the ODR was getting significantly better reception than the TCB. To further investigate, we measured the power output of all four transmitters used in my attempted QC3 as well as four other sample transmitters in the Spectrometer instrument. Each transmitter was placed inside of a Faraday enclosure with the door shut and an antenna leading to the Spectrometer. We found that the transmitters differed in power by about 2.5 divisions or 25dB. We then took the antenna out of the enclosure and measured peak power of the transmitters on a wooden bench. The difference in peak power output decreased to about 1 division, or 10dB. To ensure this isn't just due to placement on the antenna, we repeat the experiment but taking the same measurement on the same transmitter 10 times. We find that the peak power measured has a spread of 10dB. Any difference in peak power output from a transmitter that is less than 10dB can be attributed to difference in positioning with respect to the antenna. We then pull out 8 A3 transmitters and measure their spectrum. Their peak power doesn't differ by more than 10dB. To ensure that the canopy we were using provides good isolation, I place a wooden table roughly 65cm from the front face of the canopy and place an antenna connected to a signal generator on top of the table. The signal generator outputs +10dBm of 915MHz. With the canopy door closed, the spectrum analyzer sees -85dBm on one of the antennas inside of the canopy. That same antenna saw -37dBm with the door open. We then measure interference tolerance on the TCB and ODR by combining the signals from a handheld signal generator and a test transmitter. The amount of interference the receiver can allow while still receiving from the test transmitter varied based on the power output of the test transmitter and its frequency. We plot our results."
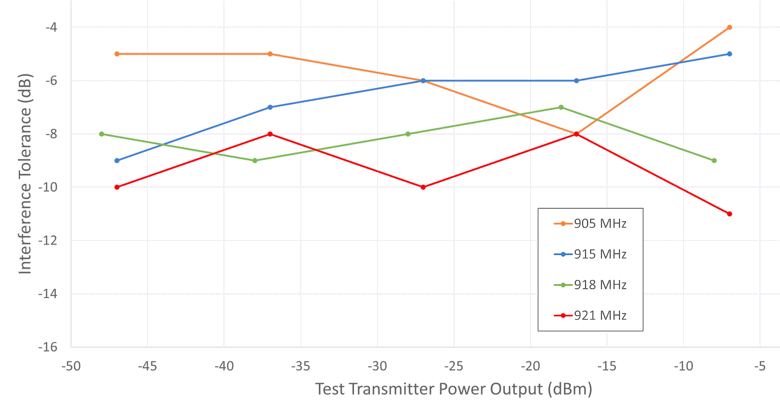
The interference tolerance of a receiver is the maximum ratio of the interference power to the signal power for which the receiver will provide 90% reception. We express this ratio in decibels. For interference in our 902-928 MHz operating band, and SCT signal varying in power from −47 dBm to −7 dBm. the ODR provides tolerance of roughly −8 dB, with a spread of 6 dB. The signal must be 8 dB more powerful than the interference, which is six times more powerful. The TCB provides an average of −11 dB tolerance, with a spread of 8 dB.
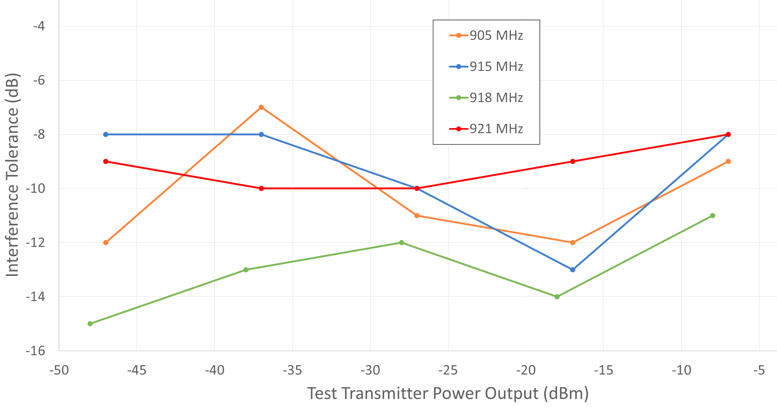
We study the sensitivity of the ODR and TCB to SCT signals with various center frequencies. Nathan reports as follows. "For both the TCB and ODR we measured sensitivity which we defined as the power input to the receiver from a test transmitter such that you would get 90% reception from the 512sps test transmitter. We measured this sensitivity on three different antenna inputs using four different test transmitters (905MHz, 915MHz, 918MHz, 921MHz). By taking a recording from the receiver and simultaneously playing it back on the neuroplayer, we use a processor script to get the average reception per interval recorded in real time. Once we managed to get about 90% reception we recorded that input power as the input's sensitivity."
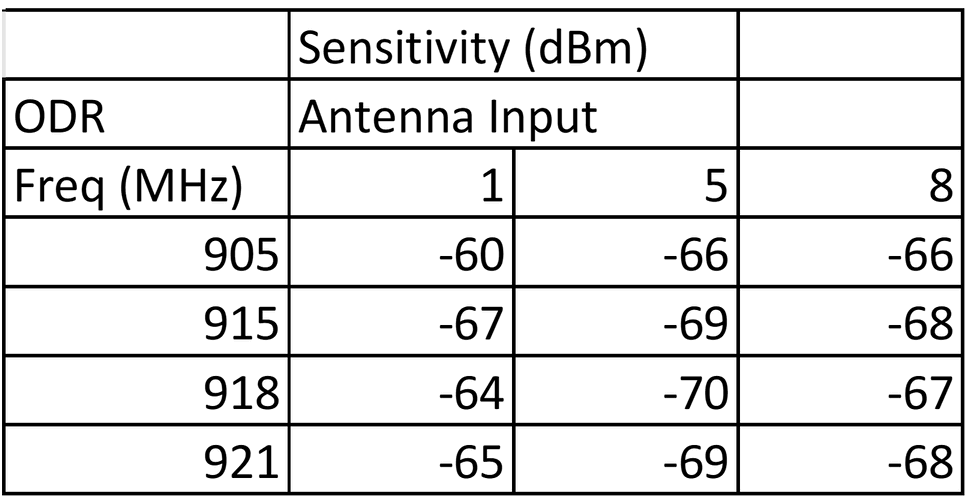
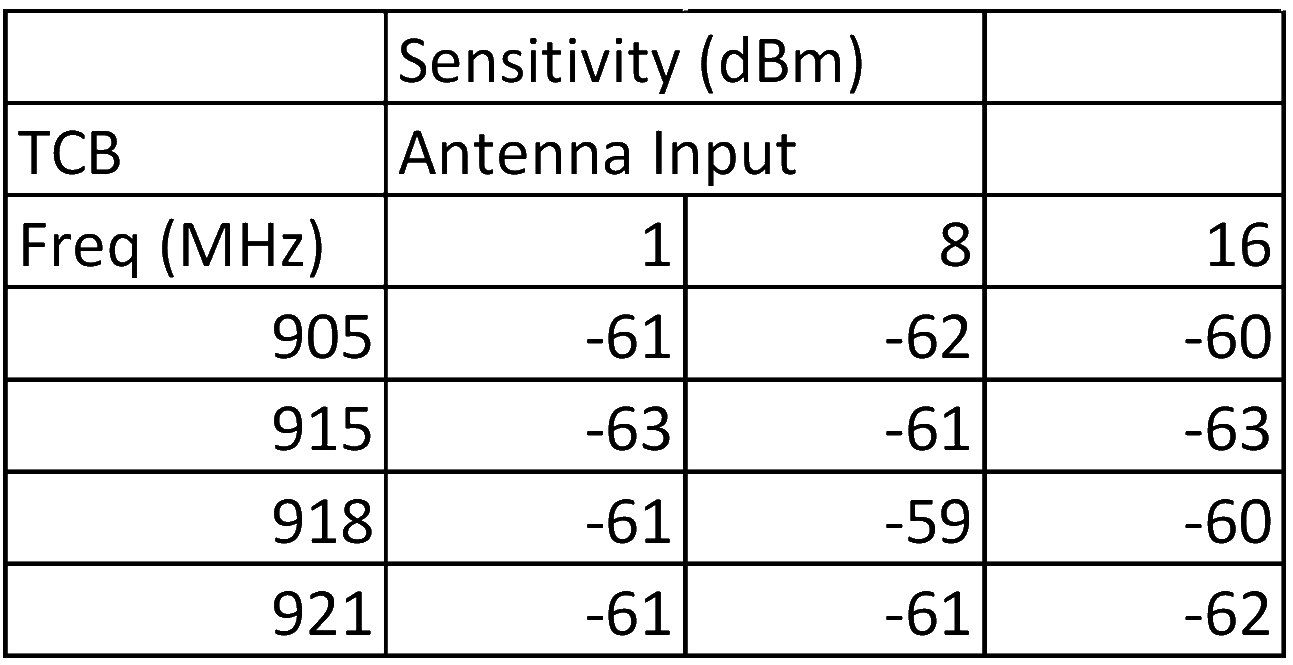
The ODR's sensitivity is −65 ±5 dBm, while that of the TCB is −61 ±2 dBm.
[12-SEP-23] We find that placing a transmitter in saline rather than water degrades reception. We place an A3028C transmitter in 20 ml of water, place it upon a horizontal loop antenna, and rotate in 45-degree steps with the label side down. We repeat with 20 ml of 1% saline.
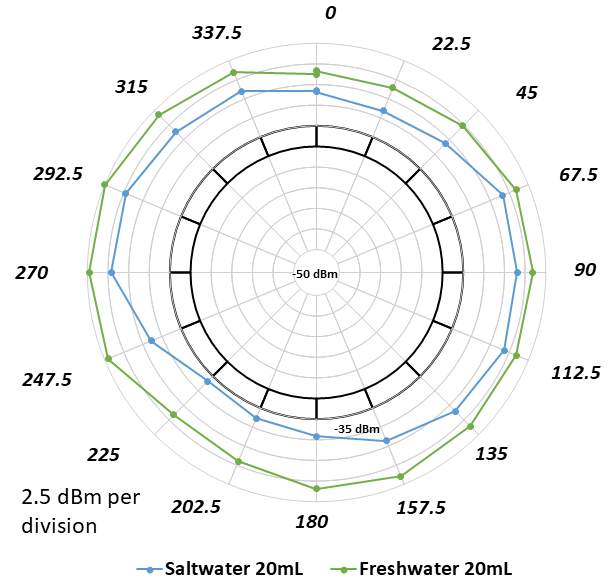
We repeat with the label up.
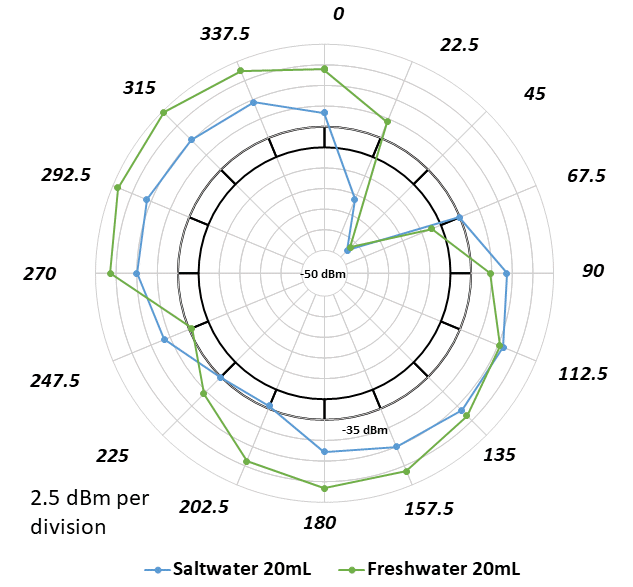
With the label up, we see a dead spot in the same place with and without salt added to the water. Received power is roughly 3 dB less from saline.
[13-SEP-23] We measure power emitted by a mouse transmitter as we cut back its EEG leads. We measure power by looking at the peak of the radio-frequency spectrum, with the transmitter sitting always in the same orientation on a horizontal loop antenna. We plot power versus lead length.
We repeat with a rat transmitter.
[14-SEP-23] We place an A3049AV3 with our 15p-200R-15p antenna network 10 cm above the center of an A3015D laying flat on our bench. We measure the spectrum of the signal received by the antenna using our A3008C sepctrometer. We use the peak of the spectrum as our measurement of the A3049AV3's output power and center frequency. We supply power to the transmitter with a bench-top power supply.
Nathan writes, "Today we explored the orientation of antennas inside of a faraday canopy. We found that reception is improved when the antennas are not flush with the absorbers. Here are the results."
We place one A3048S2 and one A3049A3, each with the 15p-200R-15p antenna network, in a sealed plastic tube with 50 ml of water. We place two more of the same transmitters in another plastic tube. We place eight antennas in our FE5AS enclosure, resting against the back wall absorbers, but perpendicular to the absorbers. We move and rotate the tubes at random throughout the enclosure volume. With TCB-A16 Y71095 and TCB-A16 Y71109 we obtain >99% reception from all six telemetry channels.
[10-OCT-23] Nathan writes, "Today we compared some S2 transmitters from the most recent UCB batch to a couple S2s that we made when initially testing the circuit. As you know, the two we made separately performed well in experiments. Today we took a recording with four antennas on two different TCBs. Transmitters 1 and 41 were put in a plastic container with water. Transmitters 2 and 55 were put in an identical plastic container with water. We then moved the transmitters throughout the canopy while recording from both TCBs. Transmitters 1 and 2 (from Nathan's batch) both gave above 98% average reception throughout the movement in the canopy. Transmitters 41 and 55 (from the UCB batch) performed just as well, giving 98% average reception in the same movement."
[13-DEC-23] At ION, their FE5A enclosure is in perfect condition after a six months of operation. But reception inside the enclosure is poor on the left side, tolerable on the right side. We note the left side curtain is open and power cords are running into the enclosure to supply infrared lights. Interference on the 10th floor of the ION building is powerful.
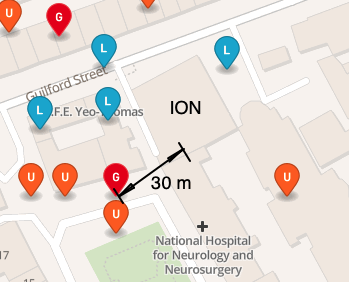
The "G" is GSM900, transmitting at 880-915 MHz for 2G. The "U" is UMTS900, also transmitting at 880-915 MHz. Both are medium power (provide 1000-m range). Both are within 30 m of the ION building.
[07-MAY-24] We are looking at base stations around a possible new telemetry site 48°07'01.3" N 1°38’13.1" W in Rennes, France. The animal facility is in the basement. We hvae this link from our potential customer, and we get the following from Open Cell ID.
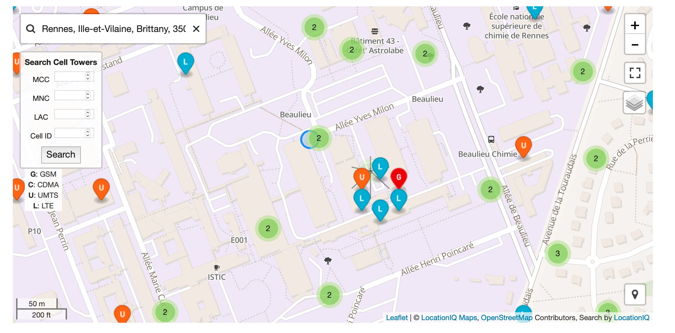
The Open Cell ID map gives the direction of the antennas. We have a GSM transmitter pointed directly at the building from a range of 50 m and a UMTS station 100 m away. Both use 900 MHz. They were most recently measured in 2013.
[25-SEP-24] Our customers at AMU perform a test of ALT reception with FE3A door open and closed, with an A3047A1B transmitter in air and in water at various heights above the ALT platform. Antoine Ghestem performs a twenty-one minute program. Time 0-3 min, SCT on platform, door closed. Time 3-6 min, SCT on platform, door open. Time 6-9 min, SCT in 400 ml water on platform, door closed. Time 9-12 min, SCT in 400 ml water on platform, door open. Time 12-15 min, SCT in 400 ml of water 3 cm above platform, door closed. Time 15-18 min, SCT in 400 ml of water 3 cm above platform, door open. Time 18-21 min, SCT in 400 ml of water moving 15 cm above platform, door open.

Reception is almost perfect the entire time, whether the Faraday enclosure is open or closed, in air or water, close to the platform or 15 cm above. While the transmitter is in water, however, we notice distinctive, similar pulses in the biopotentials occuring every three or four seconds. The pulse below is an example.

These look like electromagnetic pulse artifact. There is a radio-frequency transmitter nearby. Its transmit frequency is too far from our telemetry frequency to affect reception. But the radio-frequency power absorbed in the water generates a potential that our SCT picks up on its electrodes.
[27-FEB-25] We receive recordings from University of Manchester in which a TCB-A16 is overloaded with incoming messages. As a result, messages are stored multiple times and not consecutively, which confounds programs like PyECoG that try to read the raw NDFs. Our own Neuroplayer's signal reconstruction does fine with the signals, but we would like to avoid the overload in the long run. The University of Manchester system runs without a Faraday canopy, in the middle of an old brick building.
The above plot shows that
[13-APR-25] In LWDAQ 10.7.1 the Neuroplayer's exporter provides export to NDF, by which we Neuroplayer reconstructs the signals despite TCB overload and other sources of corruption and re-writes them to another NDF that a third-party program can read in.